Jump to US Patents to see our Patents.
Publications
![]()
Urban air pollution is a critical public health challenge in low-and-middle-income countries (LMICs). At the same time, LMICs tend to be data-poor, lacking adequate infrastructure to monitor air quality (AQ). As LMICs undergo rapid urbanization, the socio-economic burden of poor AQ will be immense. Here we present a globally scalable two-step deep learning (DL) based approach for AQ estimation in LMIC cities that mitigates the need for extensive AQ infrastructure on the ground. We train a DL model that can map satellite imagery to AQ in high-income countries (HICs) with sufficient ground data, and then adapt the model to learn meaningful AQ estimates in LMIC cities using transfer learning. The trained model can explain up to 54% of the variation in the AQ distribution of the target LMIC city without the need for target labels. The approach is demonstrated for Accra in Ghana, Africa, with AQ patterns learned and adapted from two HIC cities, specifically Los Angeles and New York.
Nishant Yadav, Meytar Sorek-Hamer, Michael Von Pohle, Ata Akbari Asanjan, Adwait Sahasrabhojanee, Esra Suel, Raphael E Arku, Violet Lingenfelter, Michael Brauer, Majid Ezzati, Nikunj Oza, Auroop R. Ganguly

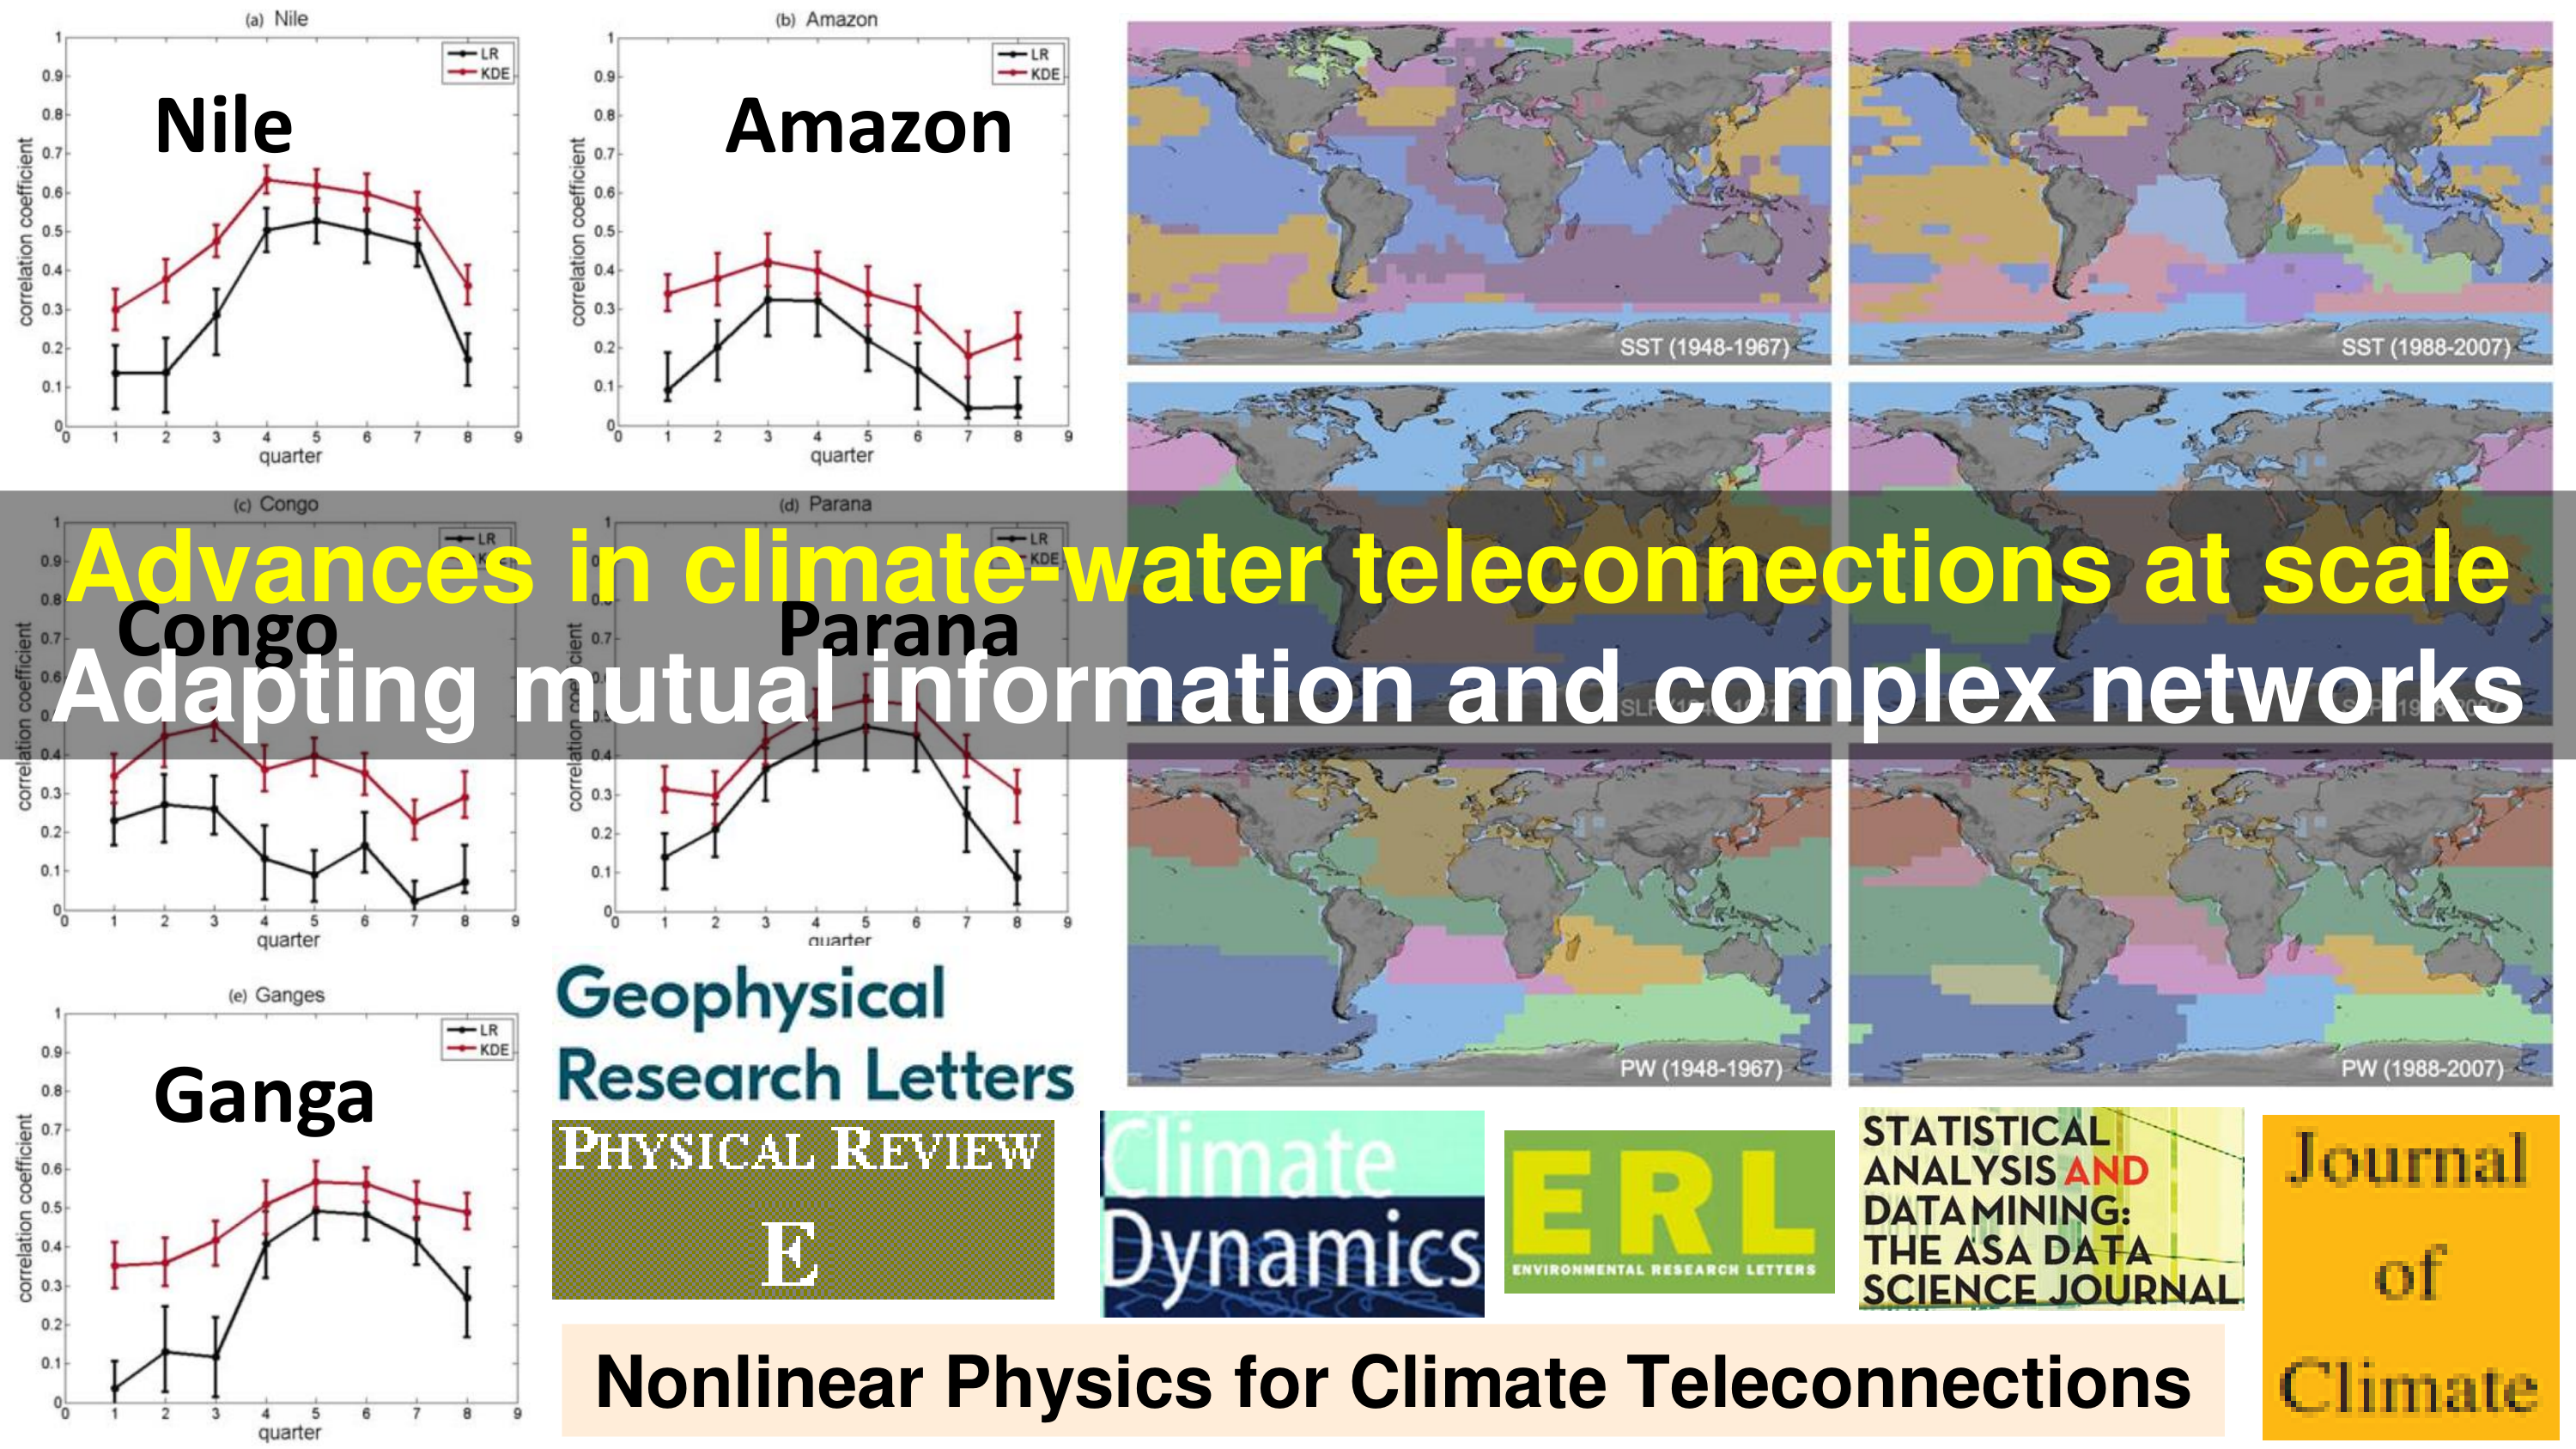
The El Niño Southern Oscillation (ENSO) is a semi-periodic fluctuation in sea surface temperature (SST) over the tropical central and eastern Pacific Ocean that influences interannual variability in regional hydrology across the world through long-range dependence or teleconnections. Recent research has demonstrated the value of Deep Learning (DL) methods for improving ENSO prediction as well as Complex Networks (CN) for understanding teleconnections. However, gaps in predictive understanding of ENSO-driven river flows include the black box nature of DL, the use of simple ENSO indices to describe a complex phenomenon and translating DL-based ENSO predictions to river flow predictions. Here we show that eXplainable DL (XDL) methods, based on saliency maps, can extract interpretable predictive information contained in global SST and discover SST information regions and dependence structures relevant for river flows which, in tandem with climate network constructions, enable improved predictive understanding. Our results reveal additional information content in global SST beyond ENSO indices, develop understanding of how SSTs influence river flows, and generate improved river flow prediction, including uncertainty estimation. Observations, reanalysis data, and earth system model simulations are used to demonstrate the value of the XDL-CN based methods for future interannual and decadal scale climate projections.
Yumin Liu, Kate Duffy, Jennifer G. Dy & Auroop R. Ganguly

Redressing global patterns of biodiversity loss requires quantitative frameworks that can predict ecosystem collapse and inform restoration strategies. By applying a network-based dynamical approach to synthetic and real-world mutualistic ecosystems, we show that biodiversity recovery following collapse is maximized when extirpated species are reintroduced based solely on their total number of connections in the original interaction network. More complex network-based strategies that prioritize the reintroduction of species that improve ‘higher order’ topological features such as compartmentalization do not provide meaningful performance improvements. These results suggest that it is possible to design nearly optimal restoration strategies that maximize biodiversity recovery for data-poor ecosystems in order to ensure the delivery of critical natural services that fuel economic development, food security, and human health around the globe.
Udit Bhatia, Sarth Dubey, Tarik C. Gouhier & Auroop R. Ganguly
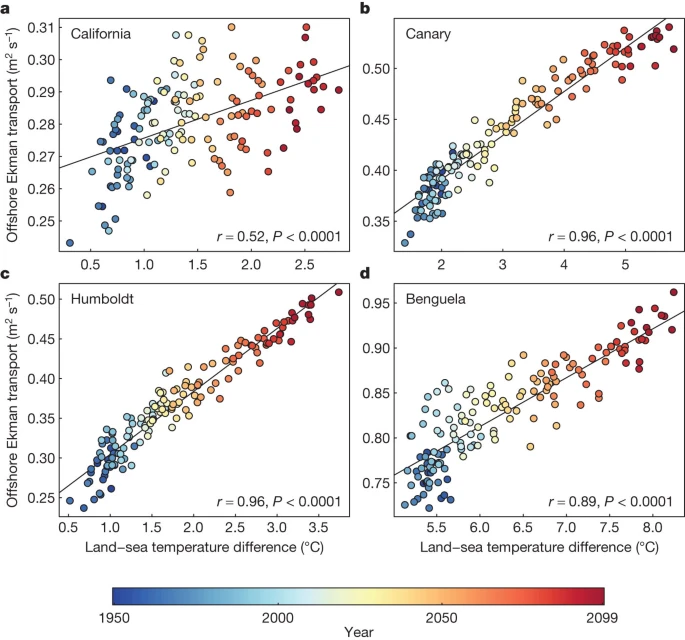
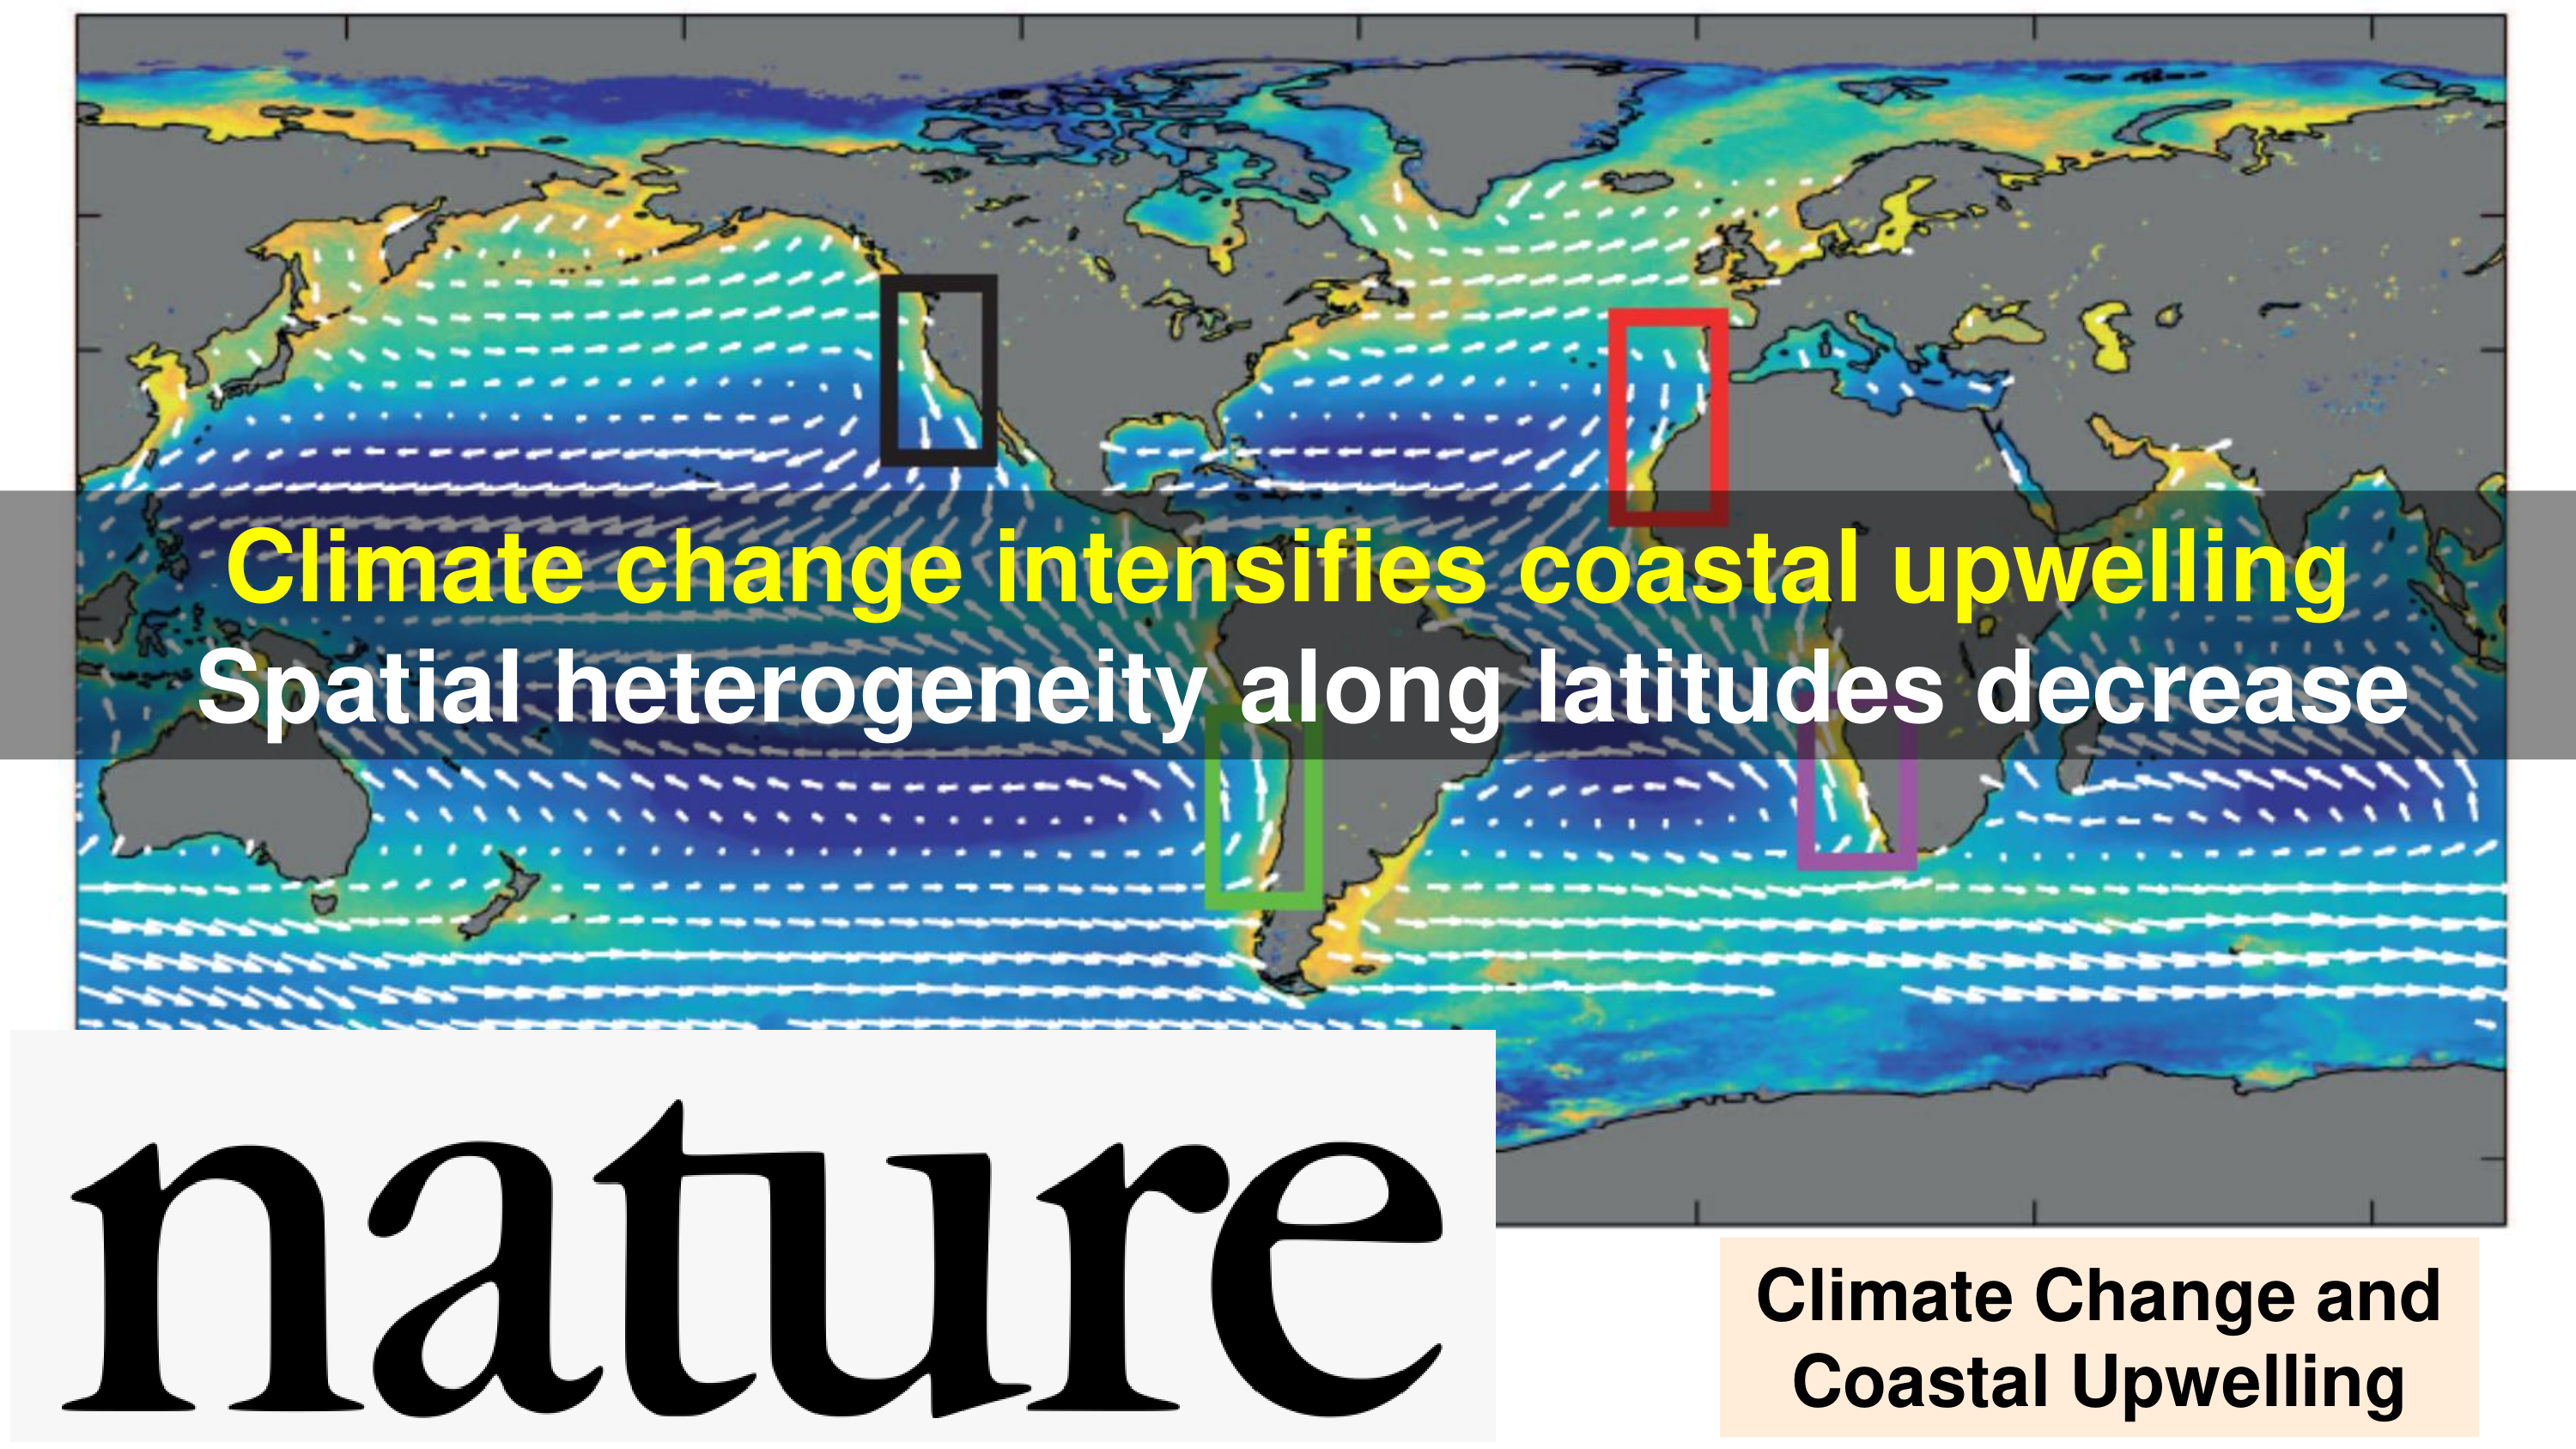
The timing and strength of wind-driven coastal upwelling along the eastern margins of major ocean basins regulate the productivity of critical fisheries and marine ecosystems by bringing deep and nutrient-rich waters to the sunlit surface, where photosynthesis can occur. How coastal upwelling regimes might change in a warming climate is therefore a question of vital importance. Although enhanced land–ocean differential heating due to greenhouse warming has been proposed to intensify coastal upwelling by strengthening alongshore winds, analyses of observations and previous climate models have provided little consensus on historical and projected trends in coastal upwelling. Here we show that there are strong and consistent changes in the timing, intensity and spatial heterogeneity of coastal upwelling in response to future warming in most Eastern Boundary Upwelling Systems (EBUSs). An ensemble of climate models shows that by the end of the twenty-first century the upwelling season will start earlier, end later and become more intense at high but not low latitudes. This projected increase in upwelling intensity and duration at high latitudes will result in a substantial reduction of the existing latitudinal variation in coastal upwelling. These patterns are consistent across three of the four EBUSs (Canary, Benguela and Humboldt, but not California). The lack of upwelling intensification and greater uncertainty associated with the California EBUS may reflect regional controls associated with the atmospheric response to climate change. Given the strong linkages between upwelling and marine ecosystems the projected changes in the intensity, timing and spatial structure of coastal upwelling may influence the geographical distribution of marine biodiversity.
Daiwei Wang, Tarik C. Gouhier, Bruce A. Menge & Auroop R. Ganguly
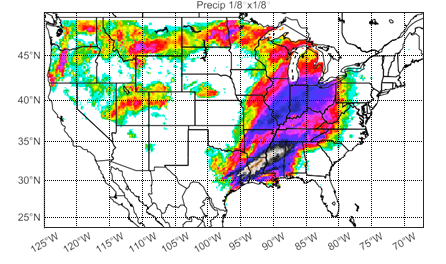
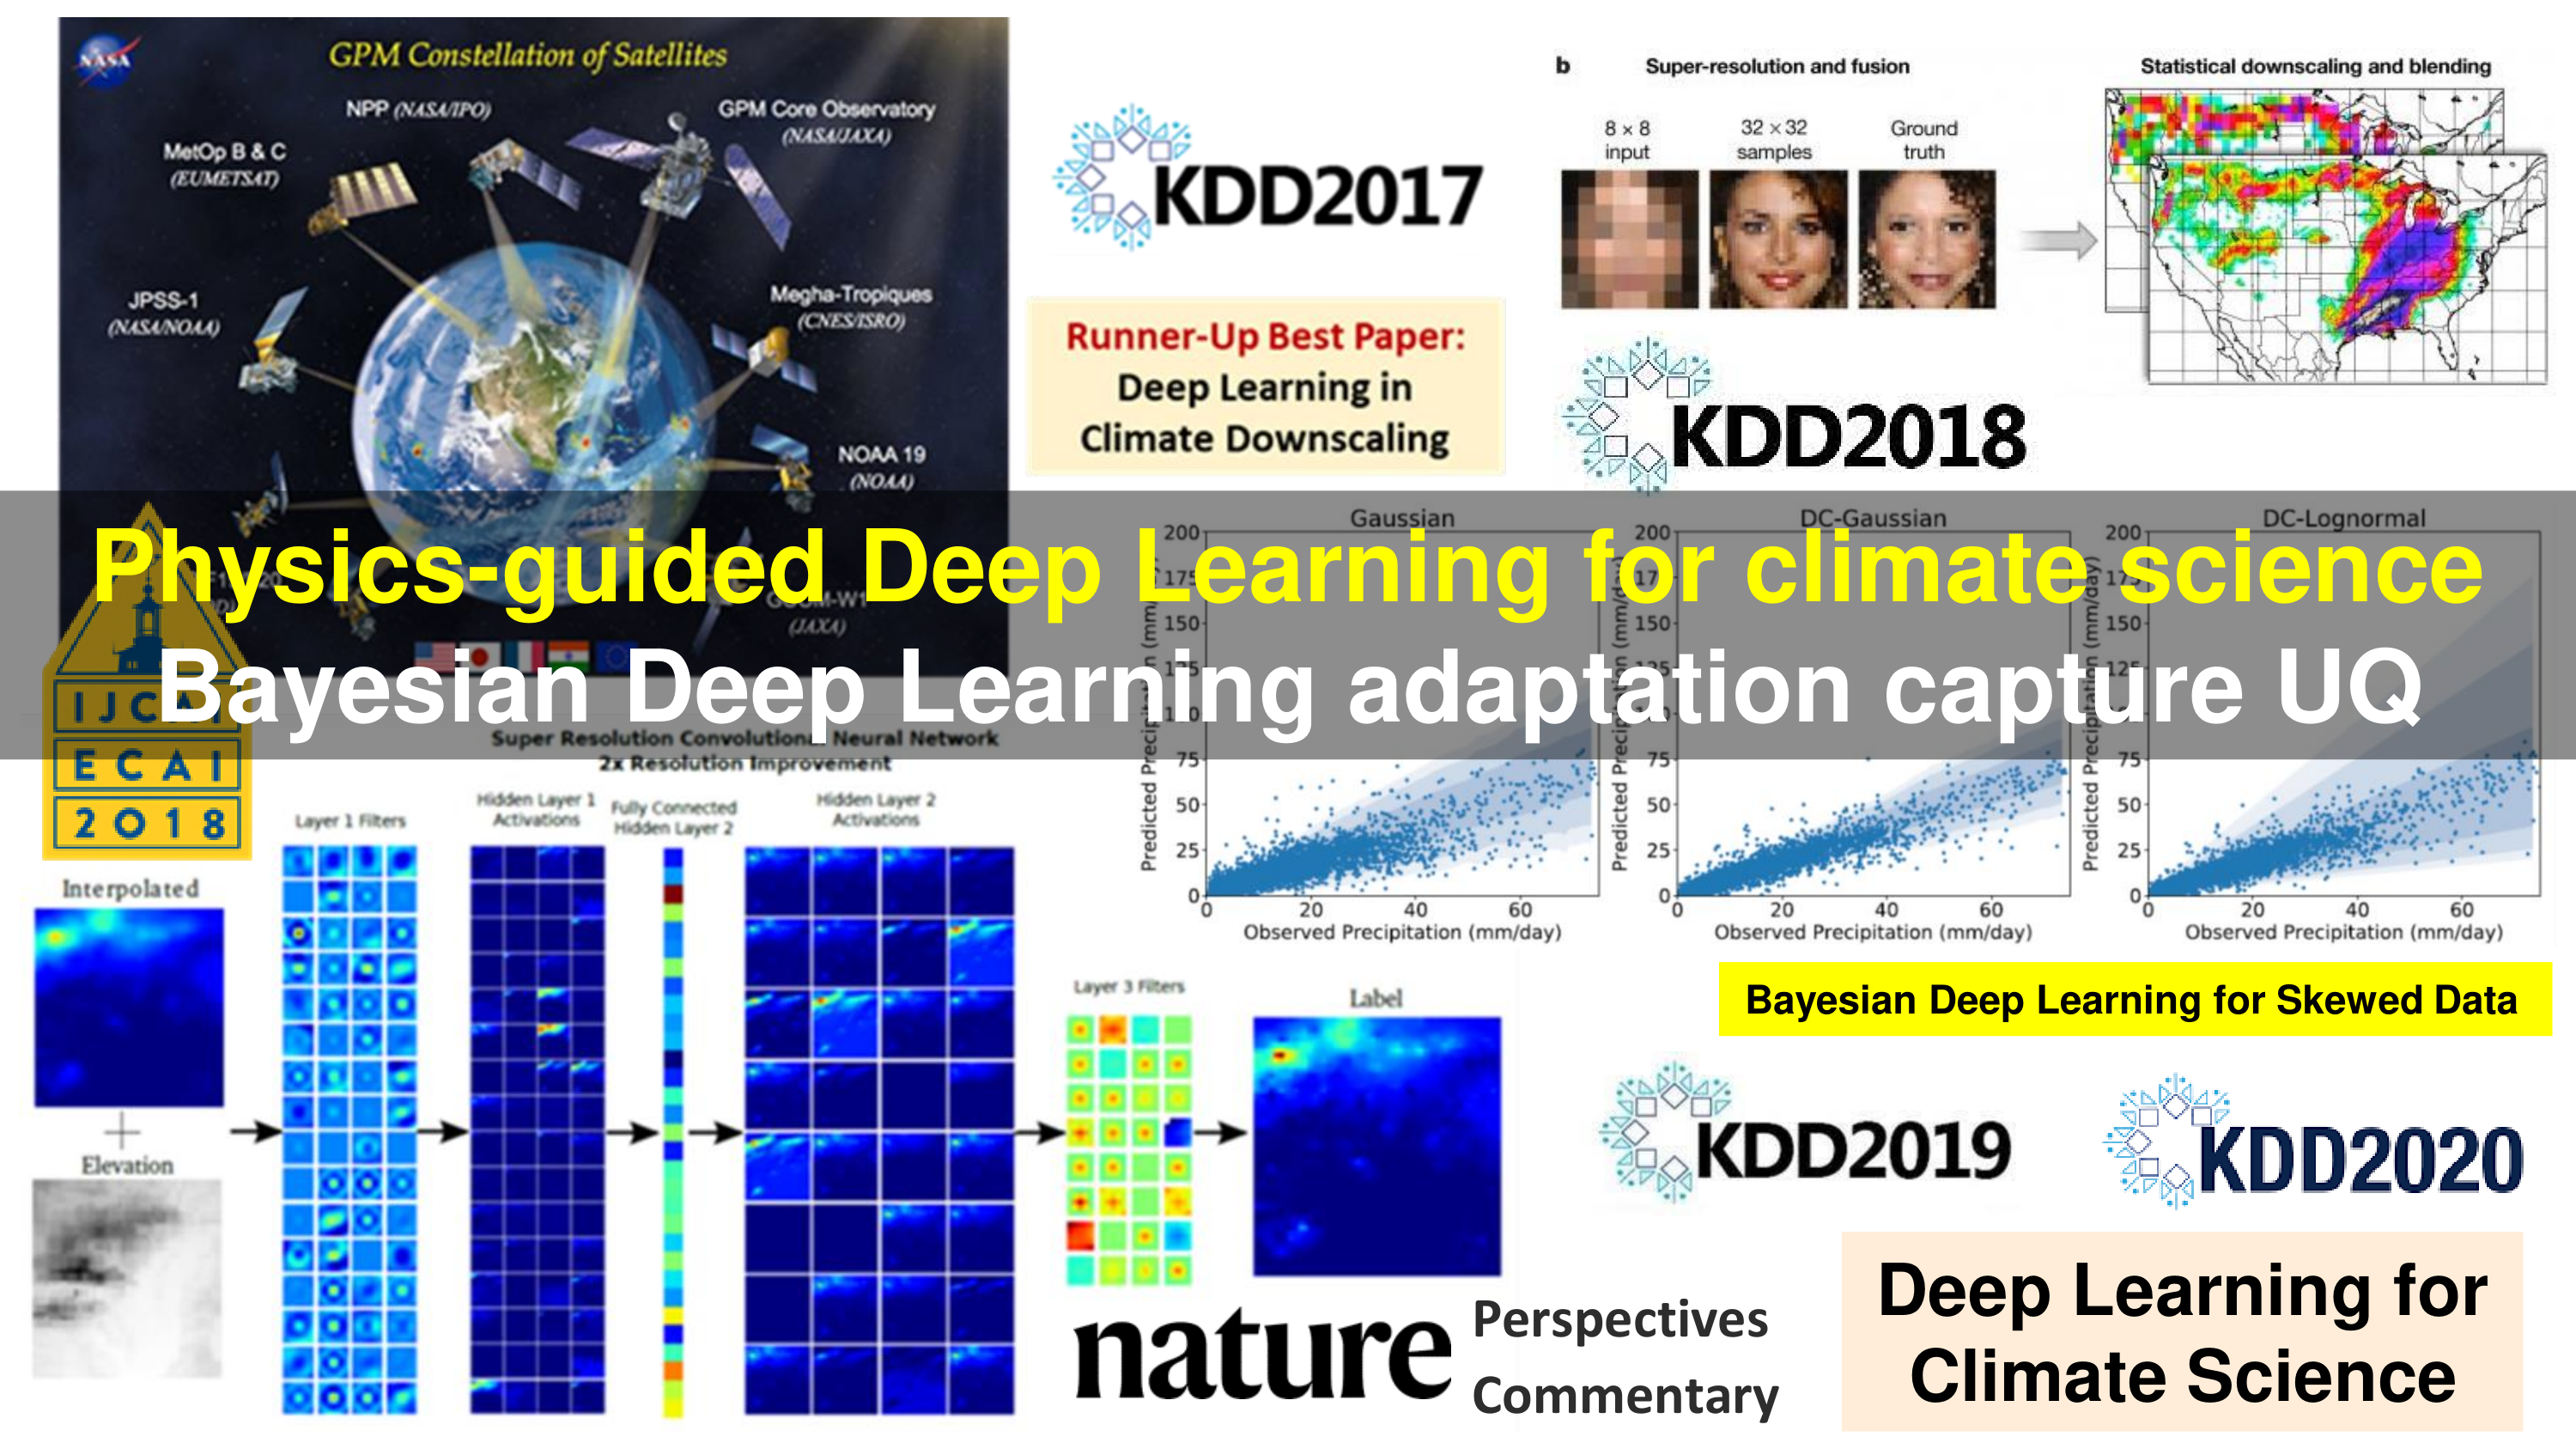
The impacts of climate change are felt by most critical systems, such as infrastructure, ecological systems, and power-plants. However,contemporary Earth System Models (ESM) are run at spatial resolutions too coarse for assessing effects this localized. Local scale projections can be obtained using statistical downscaling, a technique which uses historical climate observations to learn a low-resolution to high-resolution mapping. Depending on statistical modeling choices, downscaled projections have been shown to vary significantly terms of accuracy and reliability. The spatio-temporal nature of the climate system motivates the adaptation of super-resolution image processing techniques to statistical downscaling. In our work, we present DeepSD, a generalized stacked super resolution convolutional neural network (SRCNN) framework for statistical downscaling of climate variables. DeepSD augments SRCNN with multi-scale input channels to maximize predictability in statistical downscaling. We provide a comparison with Bias Correction Spatial Disaggregation as well as three Automated-Statistical Downscaling approaches in downscaling daily precipitation from 1 degree ( 100km) to 1/8 degrees ( 12.5km) over the Continental United States.Furthermore, a framework using the NASA Earth Exchange (NEX) platform is discussed for downscaling more than 20 ESM models with multiple emission scenarios.
Thomas Vandal, Evan Kodra, Sangram Ganguly, Andrew Michaelis, Ramakrishna Nemani, Auroop R Ganguly
ACM KDD 2017 Runner-up Best Paper Award Winner
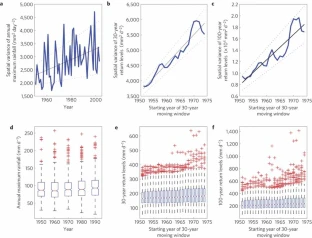
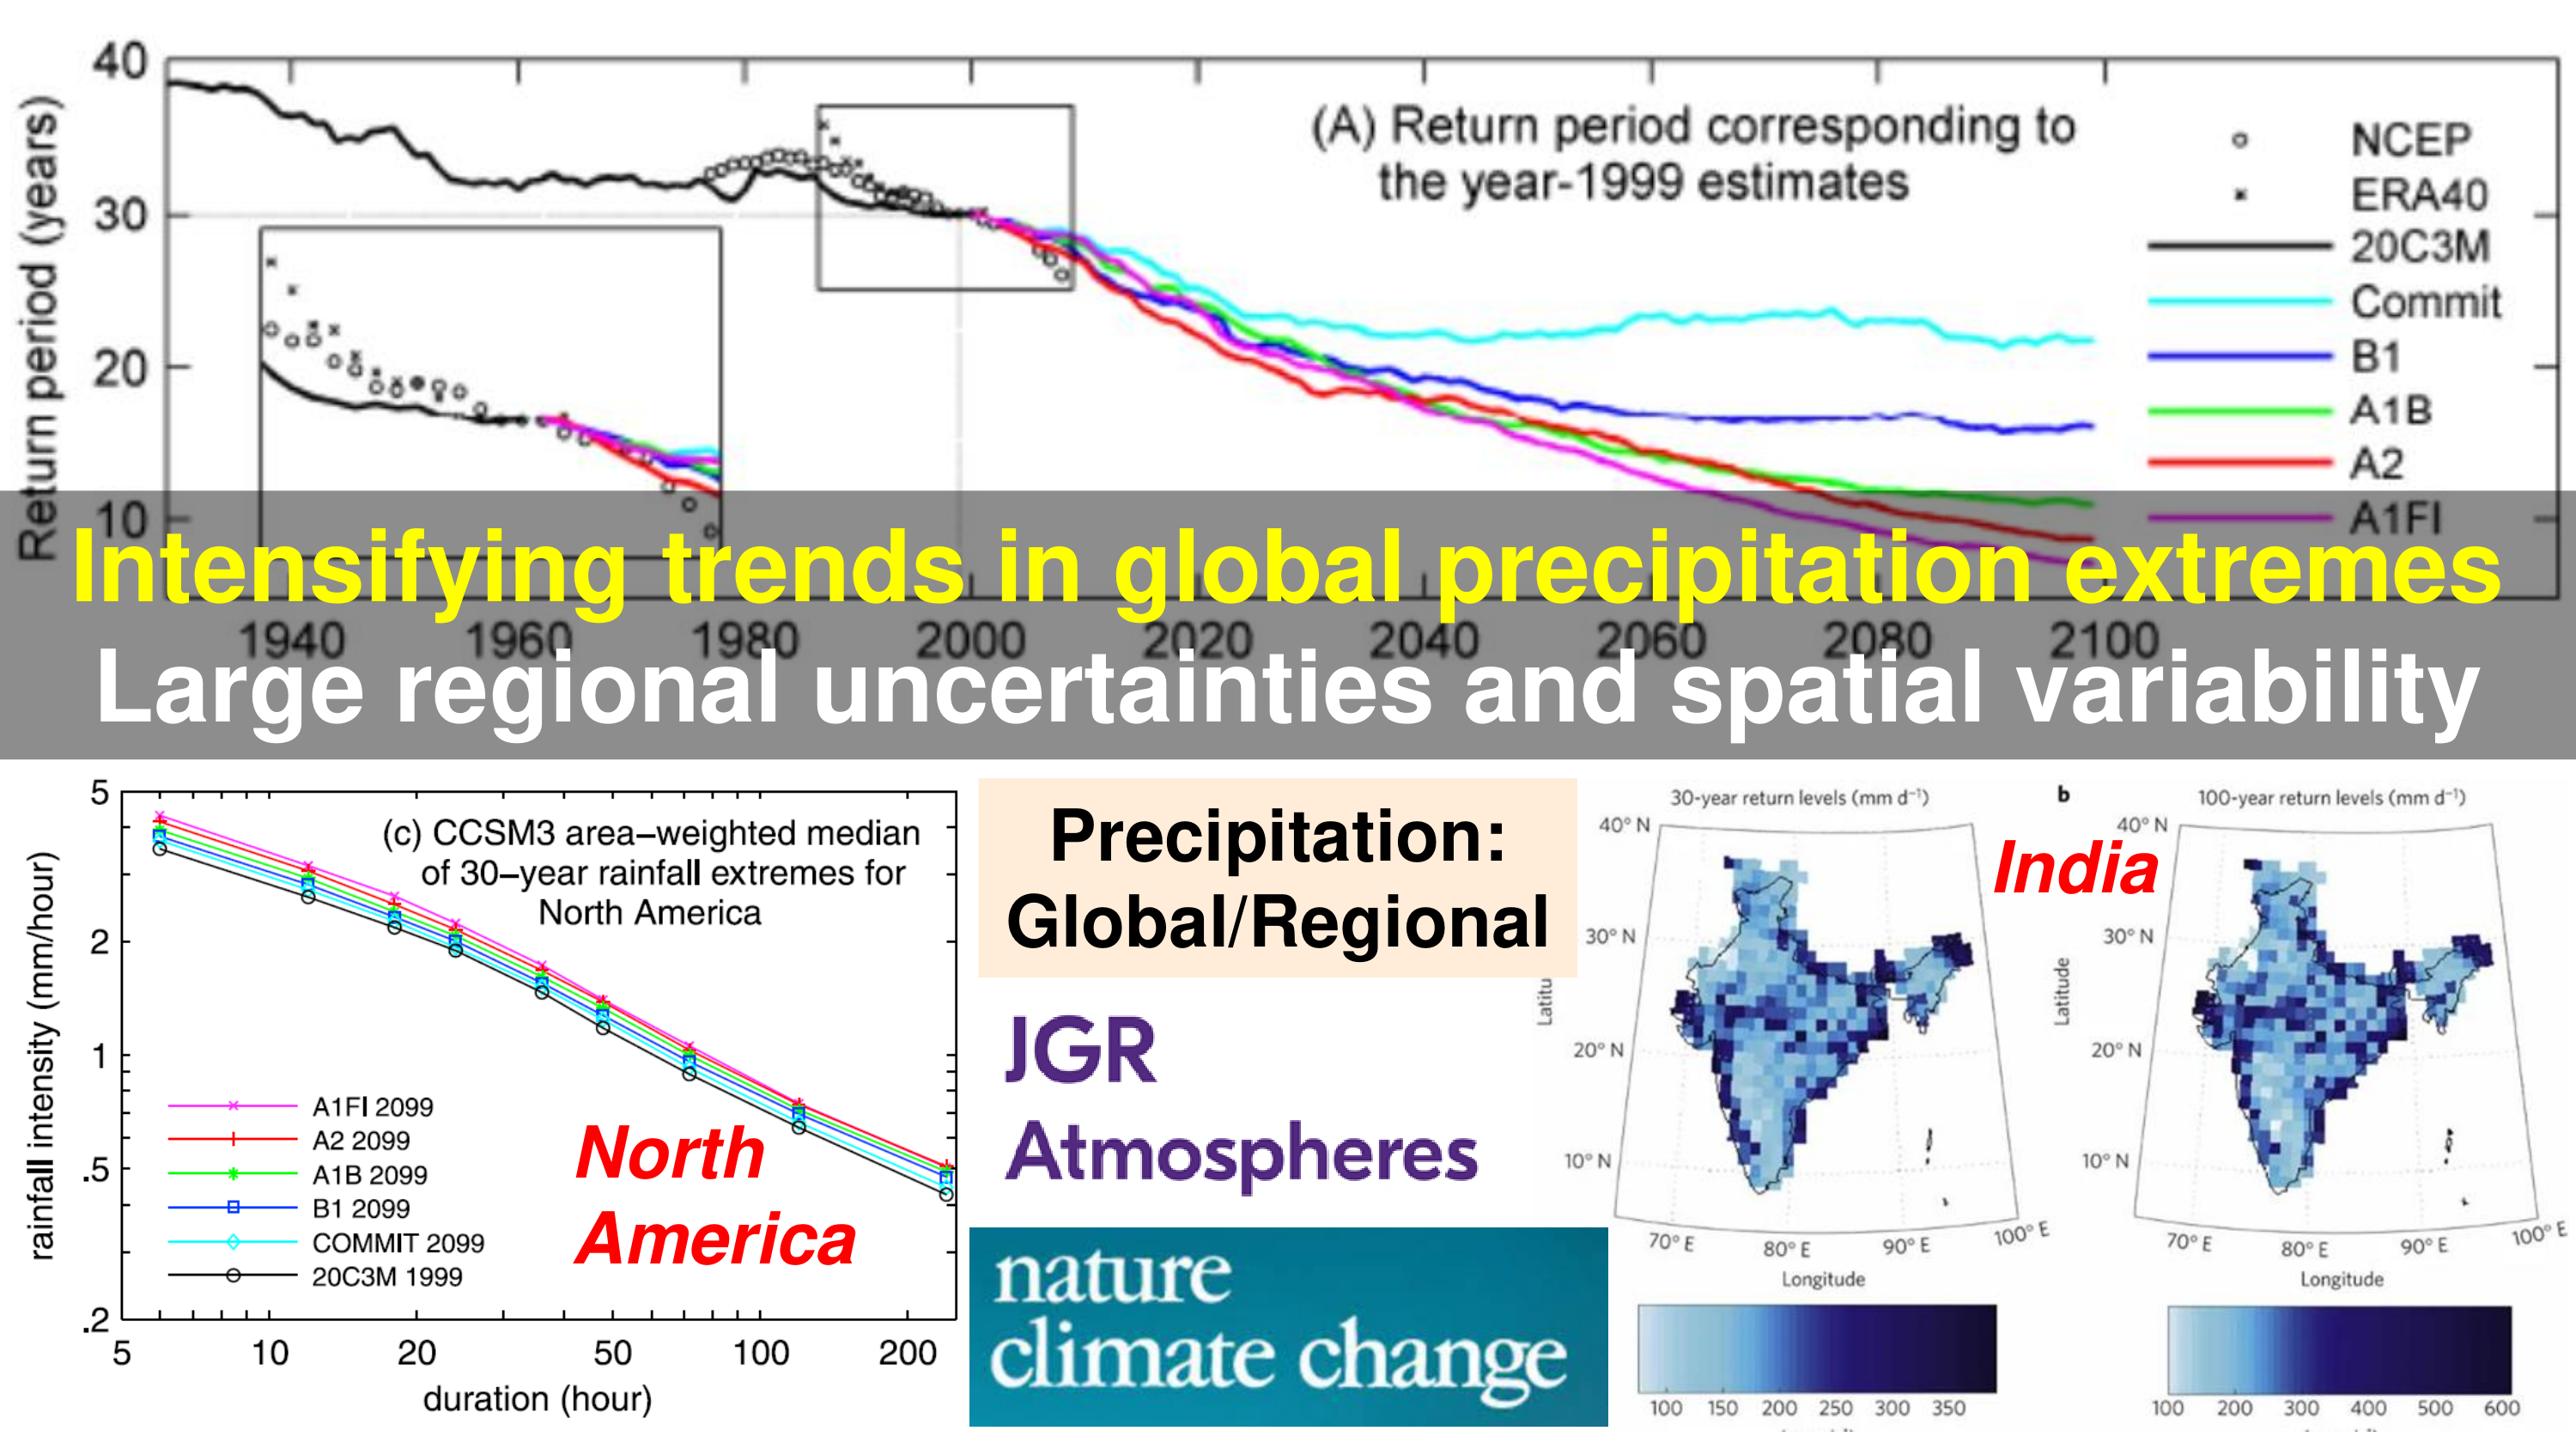
Recent studies disagree on how rainfall extremes over India have changed in space and time over the past half century as well as on whether the changes observed are due to global warming or regional urbanization7. Although a uniform and consistent decrease in moderate rainfall has been reported a lack of agreement about trends in heavy rainfall may be due in part to differences in the characterization and spatial averaging of extremes. Here we use extreme value theory to examine trends in Indian rainfall over the past half century in the context of long-term, low-frequency variability. We show that when generalized extreme value theory is applied to annual maximum rainfall over India, no statistically significant spatially uniform trends are observed, in agreement with previous studies using different approaches. Furthermore, our space–time regression analysis of the return levels points to increasing spatial variability of rainfall extremes over India. Our findings highlight the need for systematic examination of global versus regional drivers of trends in Indian rainfall extremes, and may help to inform flood hazard preparedness and water resource management in the region.
Subimal Ghosh, Debasish Das, Shih-Chieh Kao , Auroop R. Ganguly
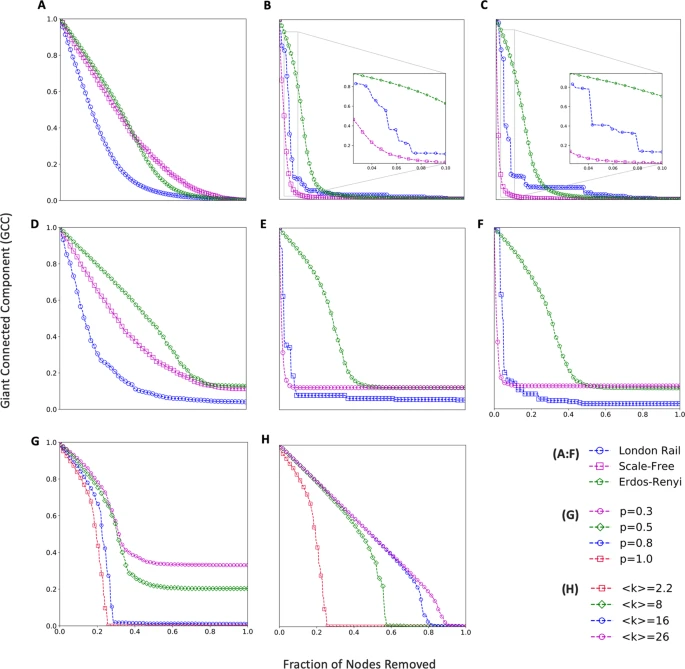
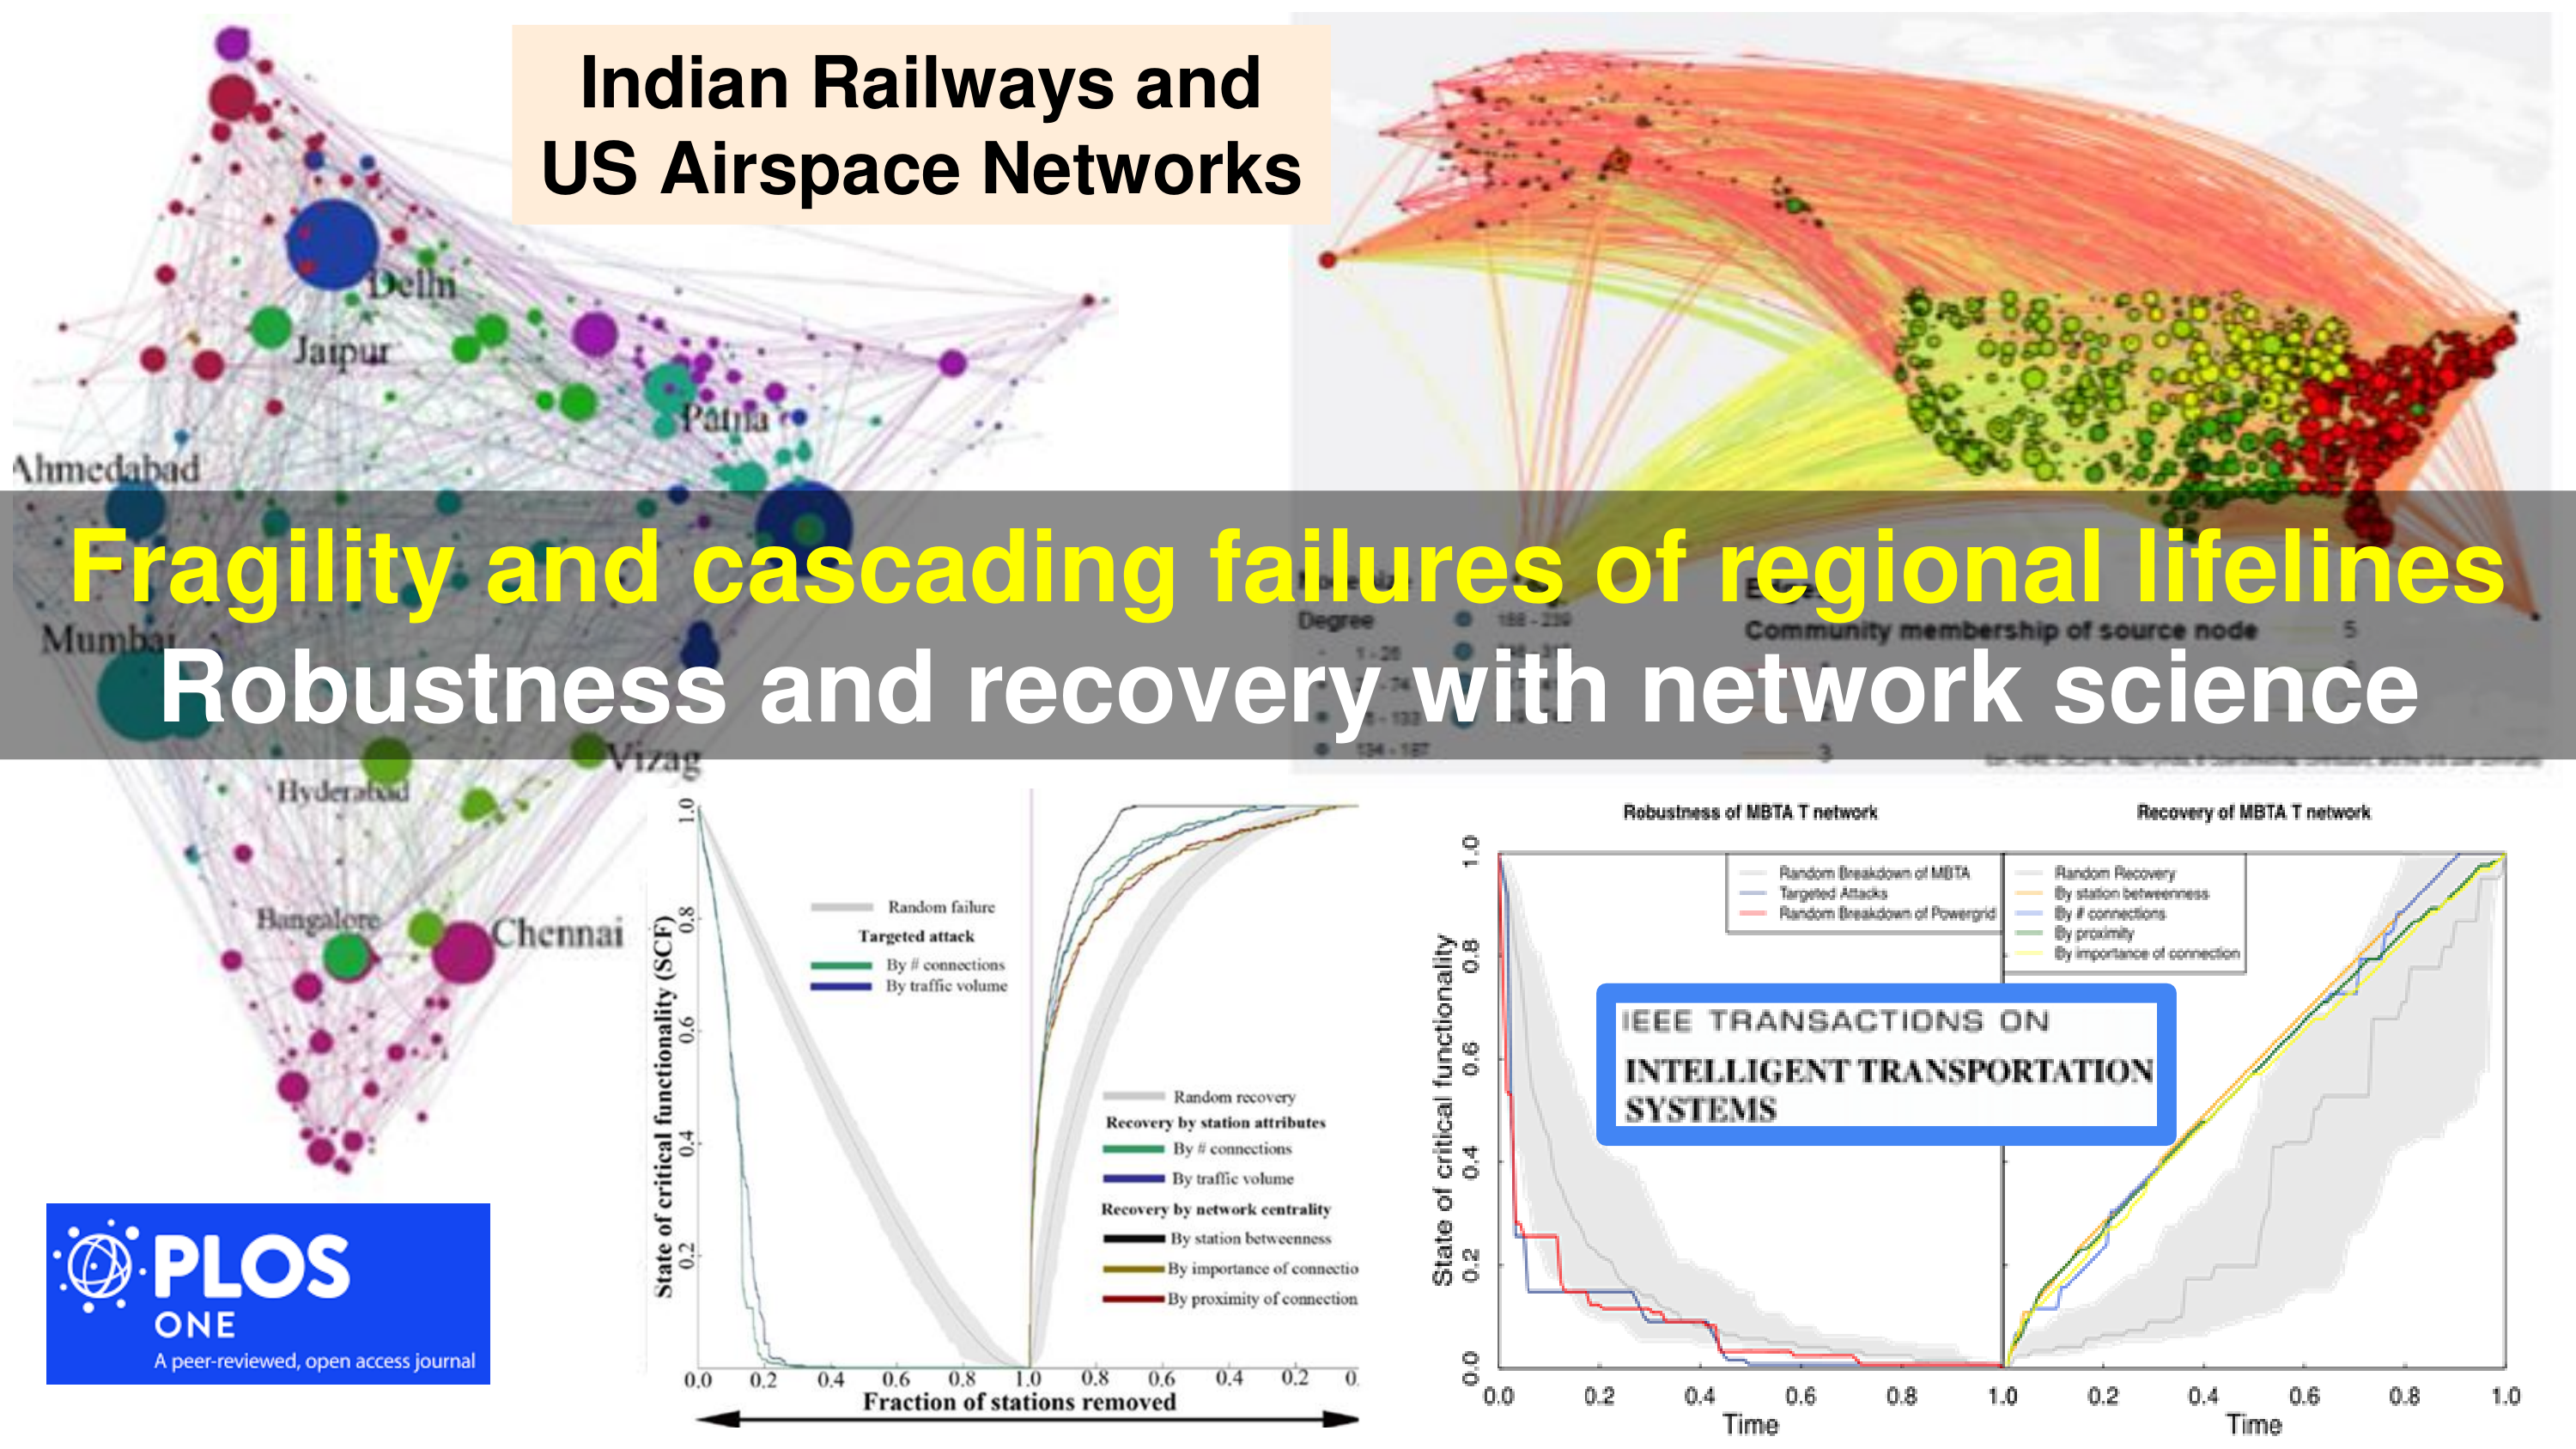
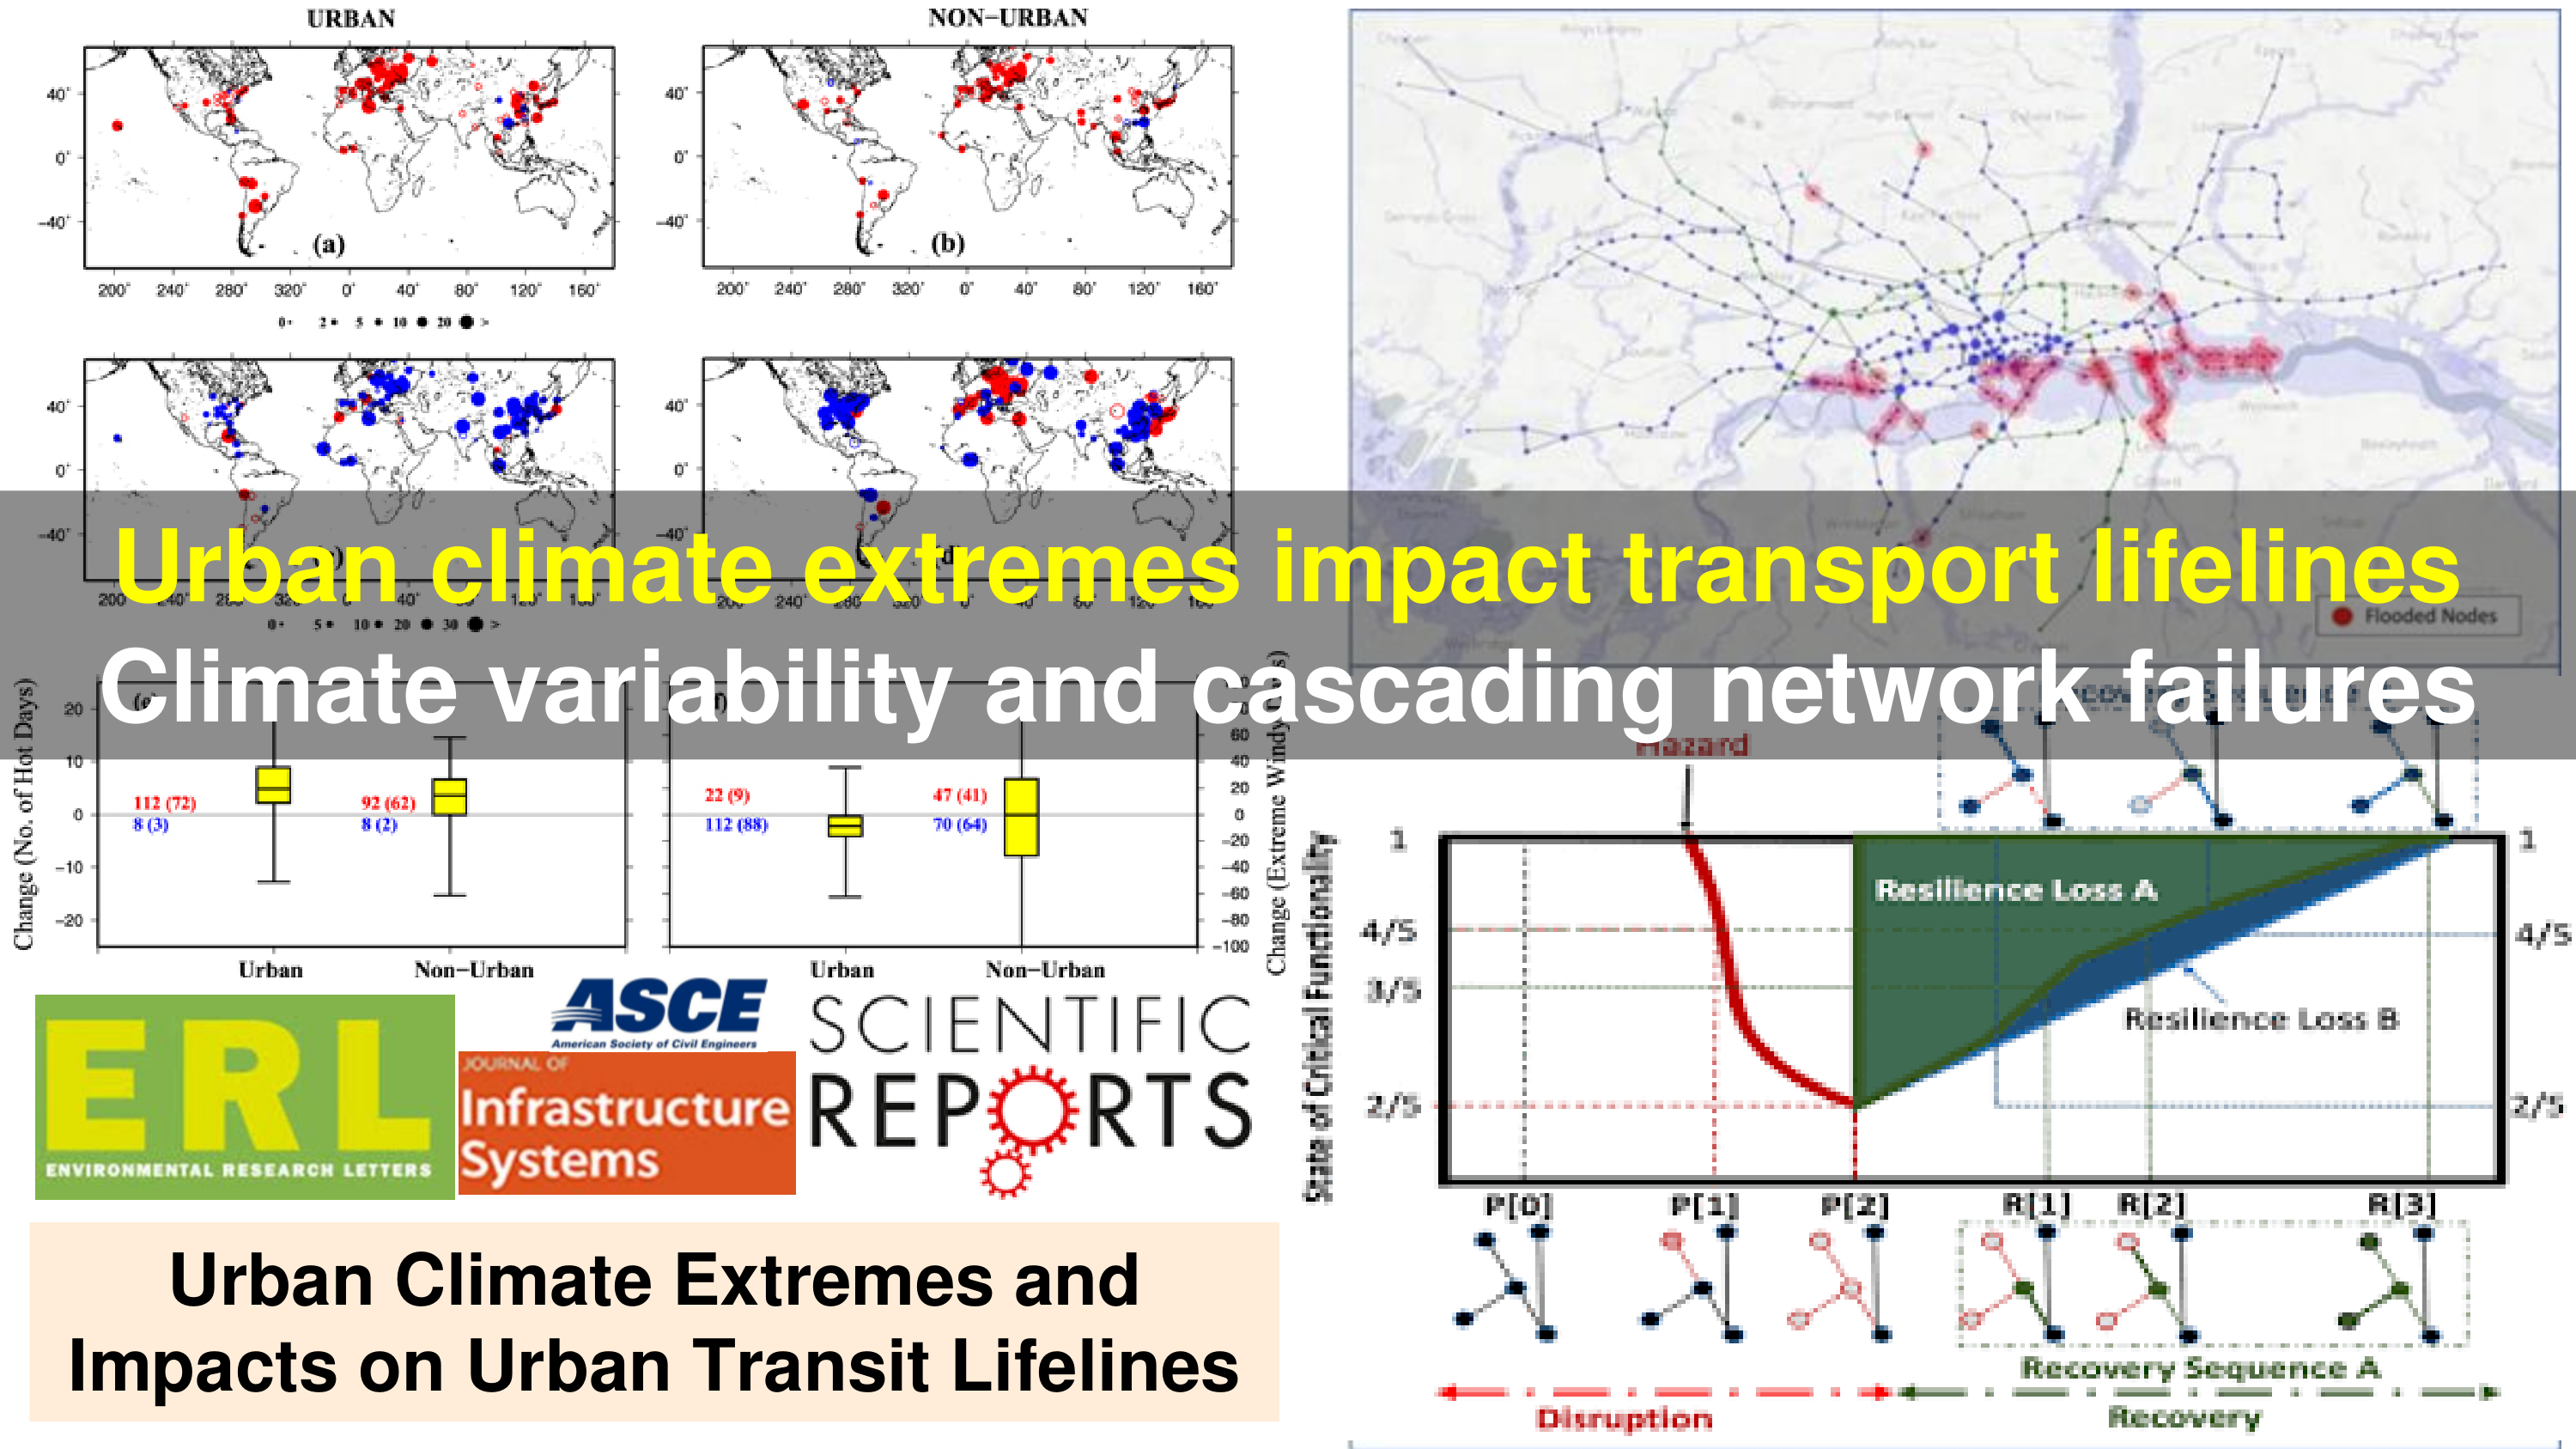
Natural hazards including floods can trigger catastrophic failures in interdependent urban transport network-of-networks (NoNs). Population growth has enhanced transportation demand while urbanization and climate change have intensified urban floods. However, despite the clear need to develop actionable insights for improving the resilience of critical urban lifelines, the theory and methods remain underdeveloped. Furthermore, as infrastructure systems become more intelligent, security experts point to the growing threat of targeted cyber-physical attacks during natural hazards. Here we develop a hypothesis-driven resilience framework for urban transport NoNs, which we demonstrate on the London Rail Network (LRN). We find that topological attributes designed for maximizing efficiency rather than robustness render the network more vulnerable to compound natural-targeted disruptions including cascading failures. Our results suggest that an organizing principle for post-disruption recovery may be developed with network science principles. Our findings and frameworks can generalize to urban lifelines and more generally to real-world spatial networks.
Nishant Yadav, Samrat Chatterjee , Auroop R. Ganguly
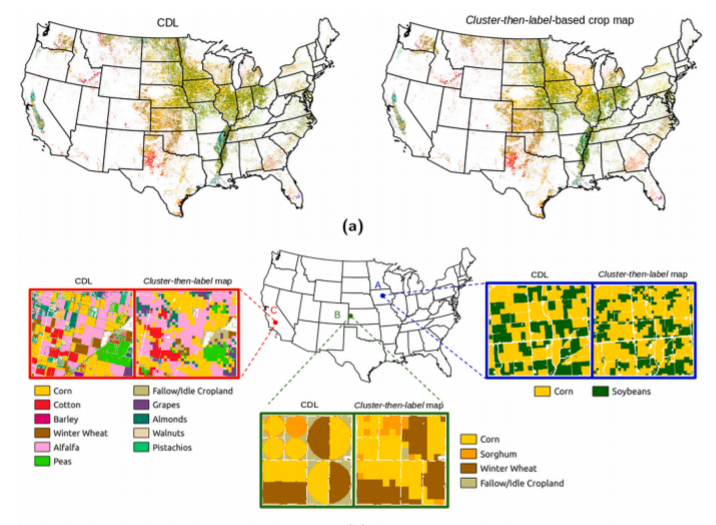
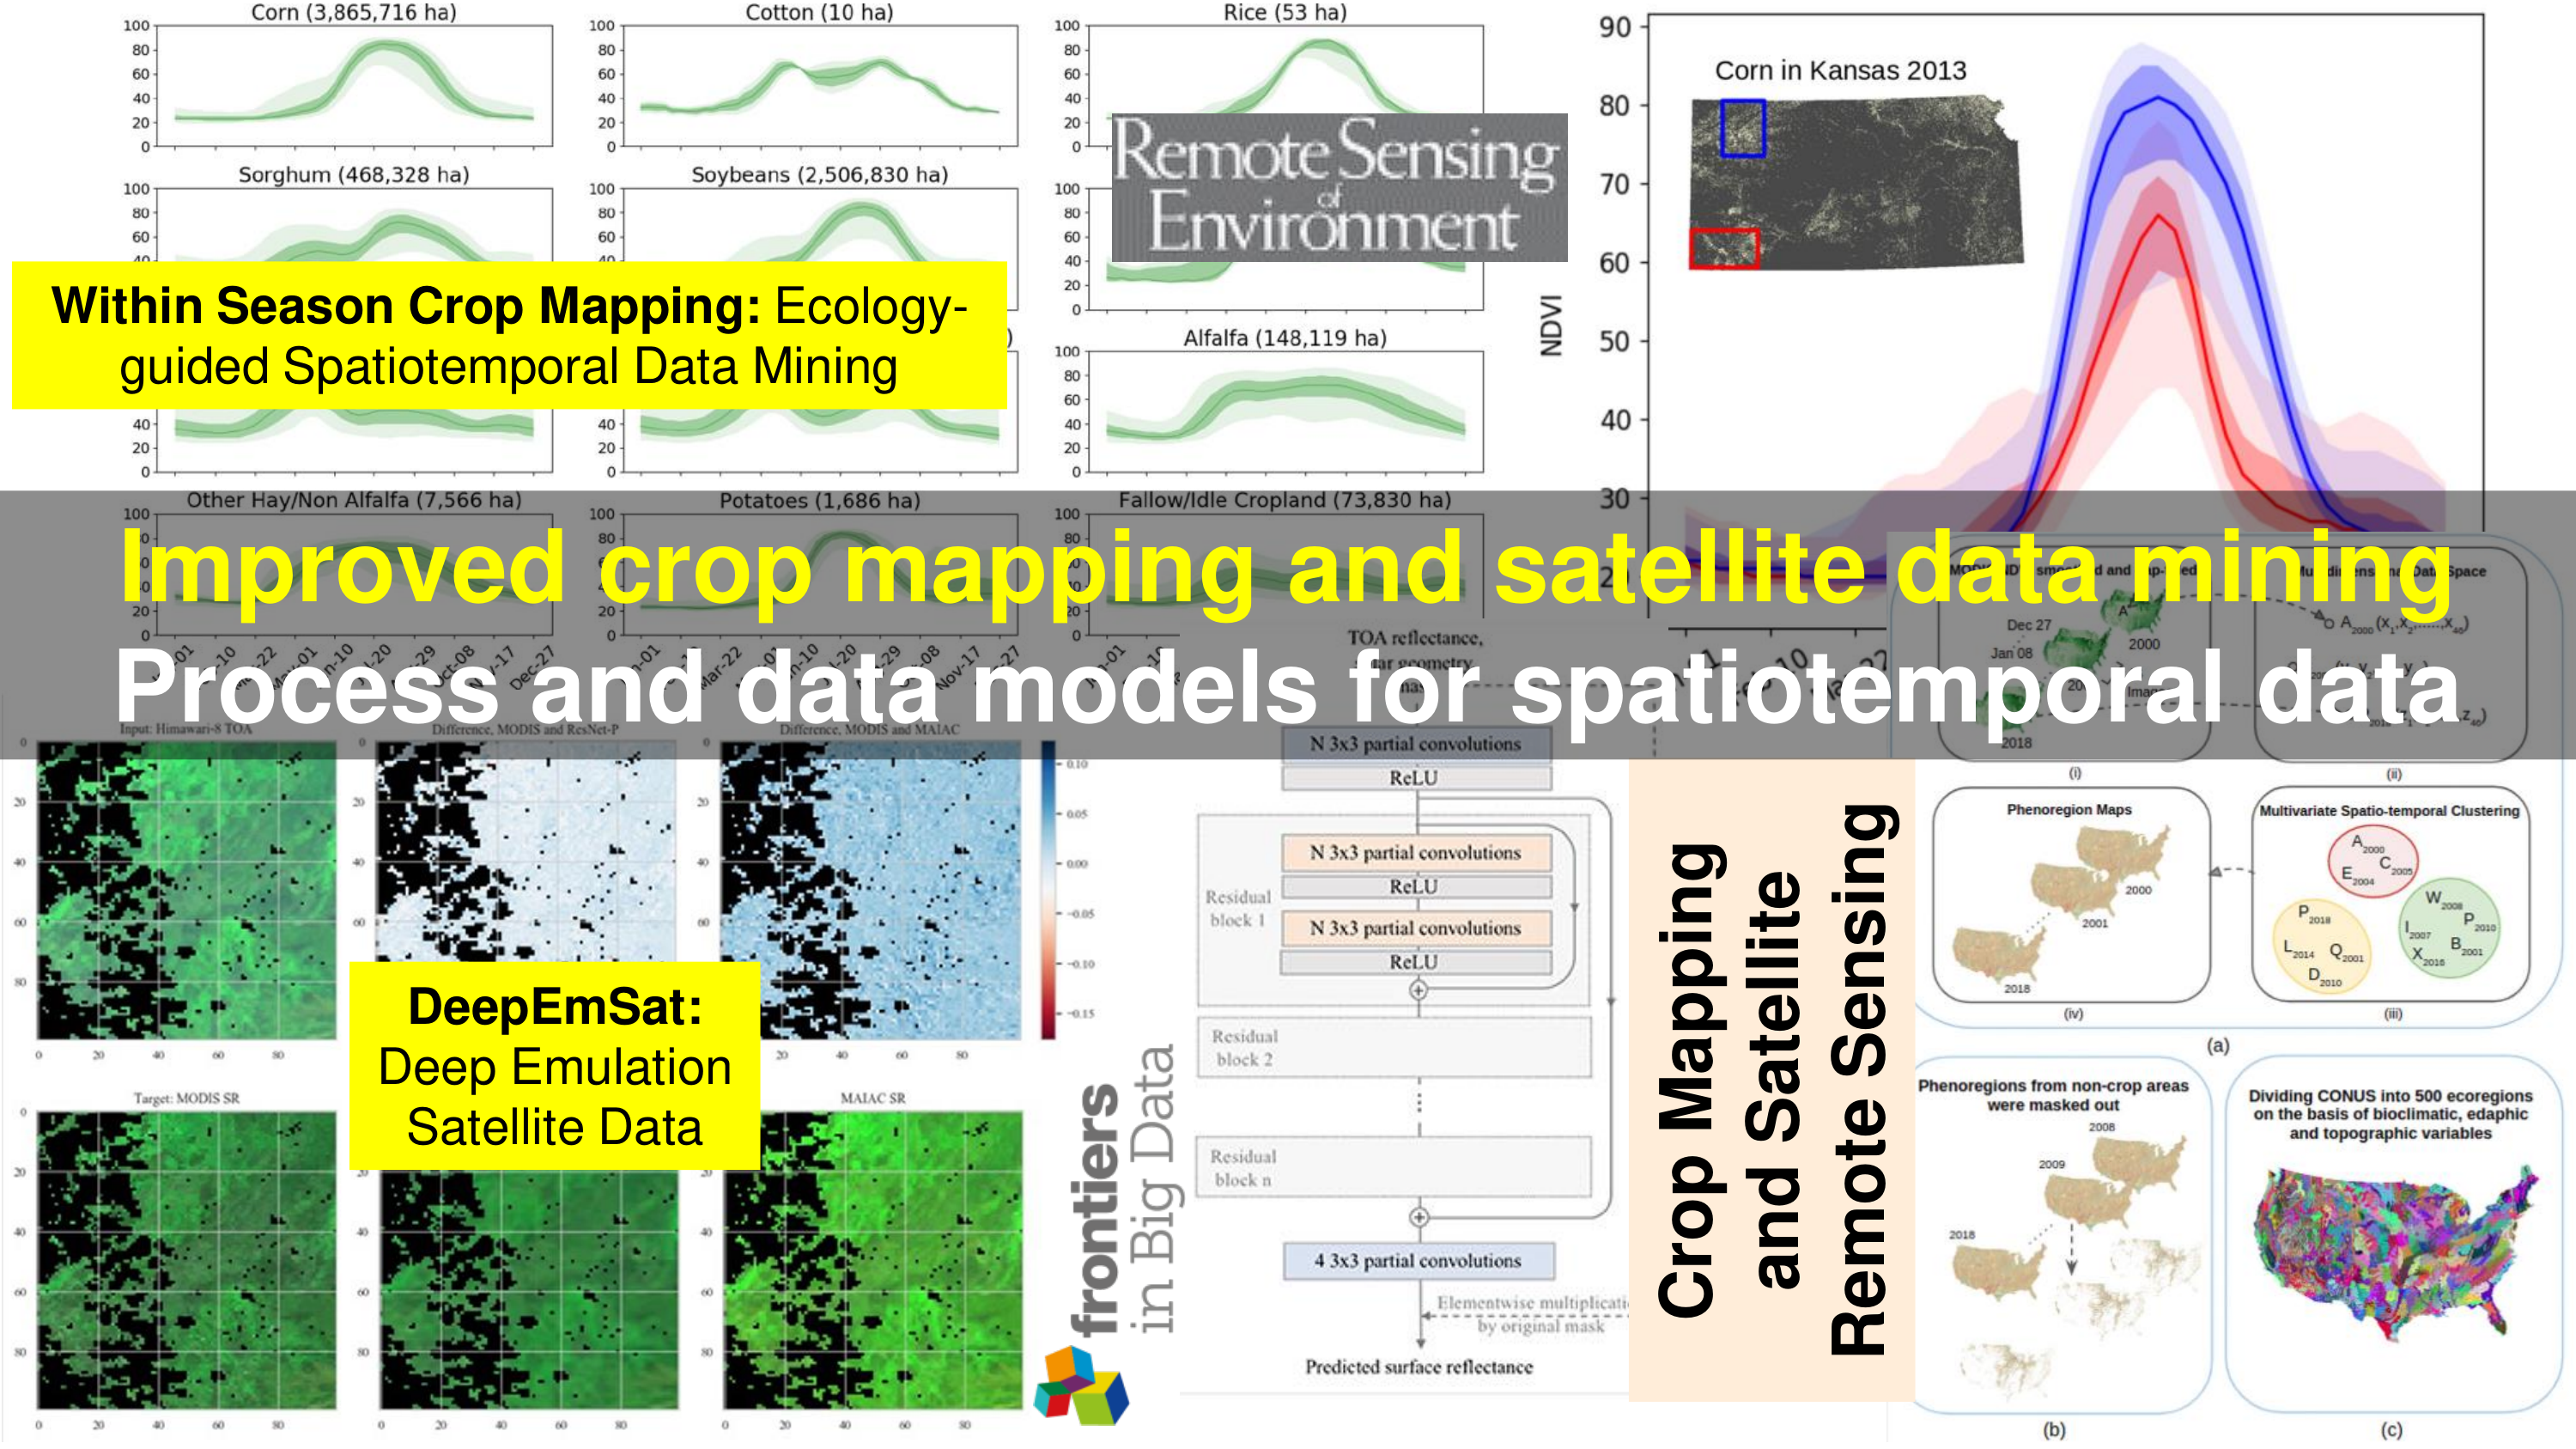
Timely and accurate knowledge about the geospatial distribution of crops at regional to continental scales is crucial for forecasting crop production and estimating crop water use. The United States (US) is one of the leading food-producing countries, but lacks a nationwide high resolution crop-specific land cover map available publicly during the current growing season. The goal of this study was to map crops across the Continental US (CONUS) before the harvest, and to estimate the earliest date of classification by which crops can be mapped with sufficient accuracy (90% of full-season accuracy). The study employed a scalable cluster-then-label model that was trained on multiple years of MODIS NDVI using ground truth data in the form of US Department of Agriculture (USDA) Cropland Data Layer (CDL) products. The first step in the crop classification was to perform Multivariate Spatio-Temporal Clustering (MSTC) of annual MODIS-derived NDVI trajectories to create phenologically similar regions, or phenoregions. The second step was to assign crop labels to phenoregions based on spatial concordance between phenoregions and crop classes from CDL using Mapcurves. Assigning crop labels to phenoregions was performed within ecoregions to reduce classification errors due to spatial variability in phenology caused by variations in climate, agricultural practices, and growing conditions. The crop classifier was trained and validated on the years 2008–2014, then tested independently on 2015–2018. Ecoregion-level crop classification performed better than state-level and CONUS-level classification. Pixel-wise accuracy of classification for eight major crops by area was around 70% across the major corn-, soybeans- and winter wheatproducing areas, whereas regions characterized by high crop diversity had slightly lower accuracy. Classification accuracy for dominant crops like corn, soybeans, winter wheat, fallow/idle cropland and other hay/non alfalfa improved with time as they grew, reaching 90% of year-end accuracy by the end of August over each of the four unseen years in the test period. For corn and soybeans, the earliest dates of classification were found to be much earlier in the central regions of the Corn Belt (parts of Iowa, Illinois and Indiana) than in peripheral areas. The ability to map growing crops may permit near real-time monitoring of the health status and vigor of agricultural crops nationally.
Venkata Shashank Konduri,Jitendra Kumar, William W. Hargrove, Forrest M. Hoffman, Auroop R.Ganguly
Selected Publications and Links
- Slide 1: SDS Lab -- Lab PI, Spinout, Patents/Books, and Grand Challenges
- PI Auroop Ganguly Websites: Northeastern University; SDS Lab; Wikipedia; ASCE; NSF News; NSF Media; DoD NICE; KDD Award; Best Posters (AMS; AGU)
- SDS Lab: Primary website; NU site; SDS spinout risQ (News: Business Wire; Politico; Bond Buyer; Breckenridge ESG; NSF SBIR: Phase I and Phase II)
- US Patents: Climate Risk (NU News) and Network Resilience (NU News)
- Textbook: Critical Infrastructure Resilience (Taylor & Francis; Amazon) and Book Interview (Big Data journal)
- Edited Books and Reports: Knowledge Discovery from Sensor Data (Edition 1; Edition 2) with ACM SIGKDD Explorations reports (2008; 2009; 2010); Agent-Based Modeling (Book; Chapter)
- Grand Challenge: (1) US DOE AI4ESP white paper: Science-integrated Artificial-intelligence for Flooding and precipitation Extremes (SAFE)
- Grand Challenge: (2) Frontiers in Water Specialty Chief Editor's column: Water and the Built Environment
- Grand Challenge: (3) Climate Resilience and Data Driven Solutions: UNA-UK Climate 2020 Data Driven Solutions (Article and Demo: Fig. 2) and Sustained National Climate Assessment (SCAN, History, WSC Paper: full version; BAMS Paper: summary)
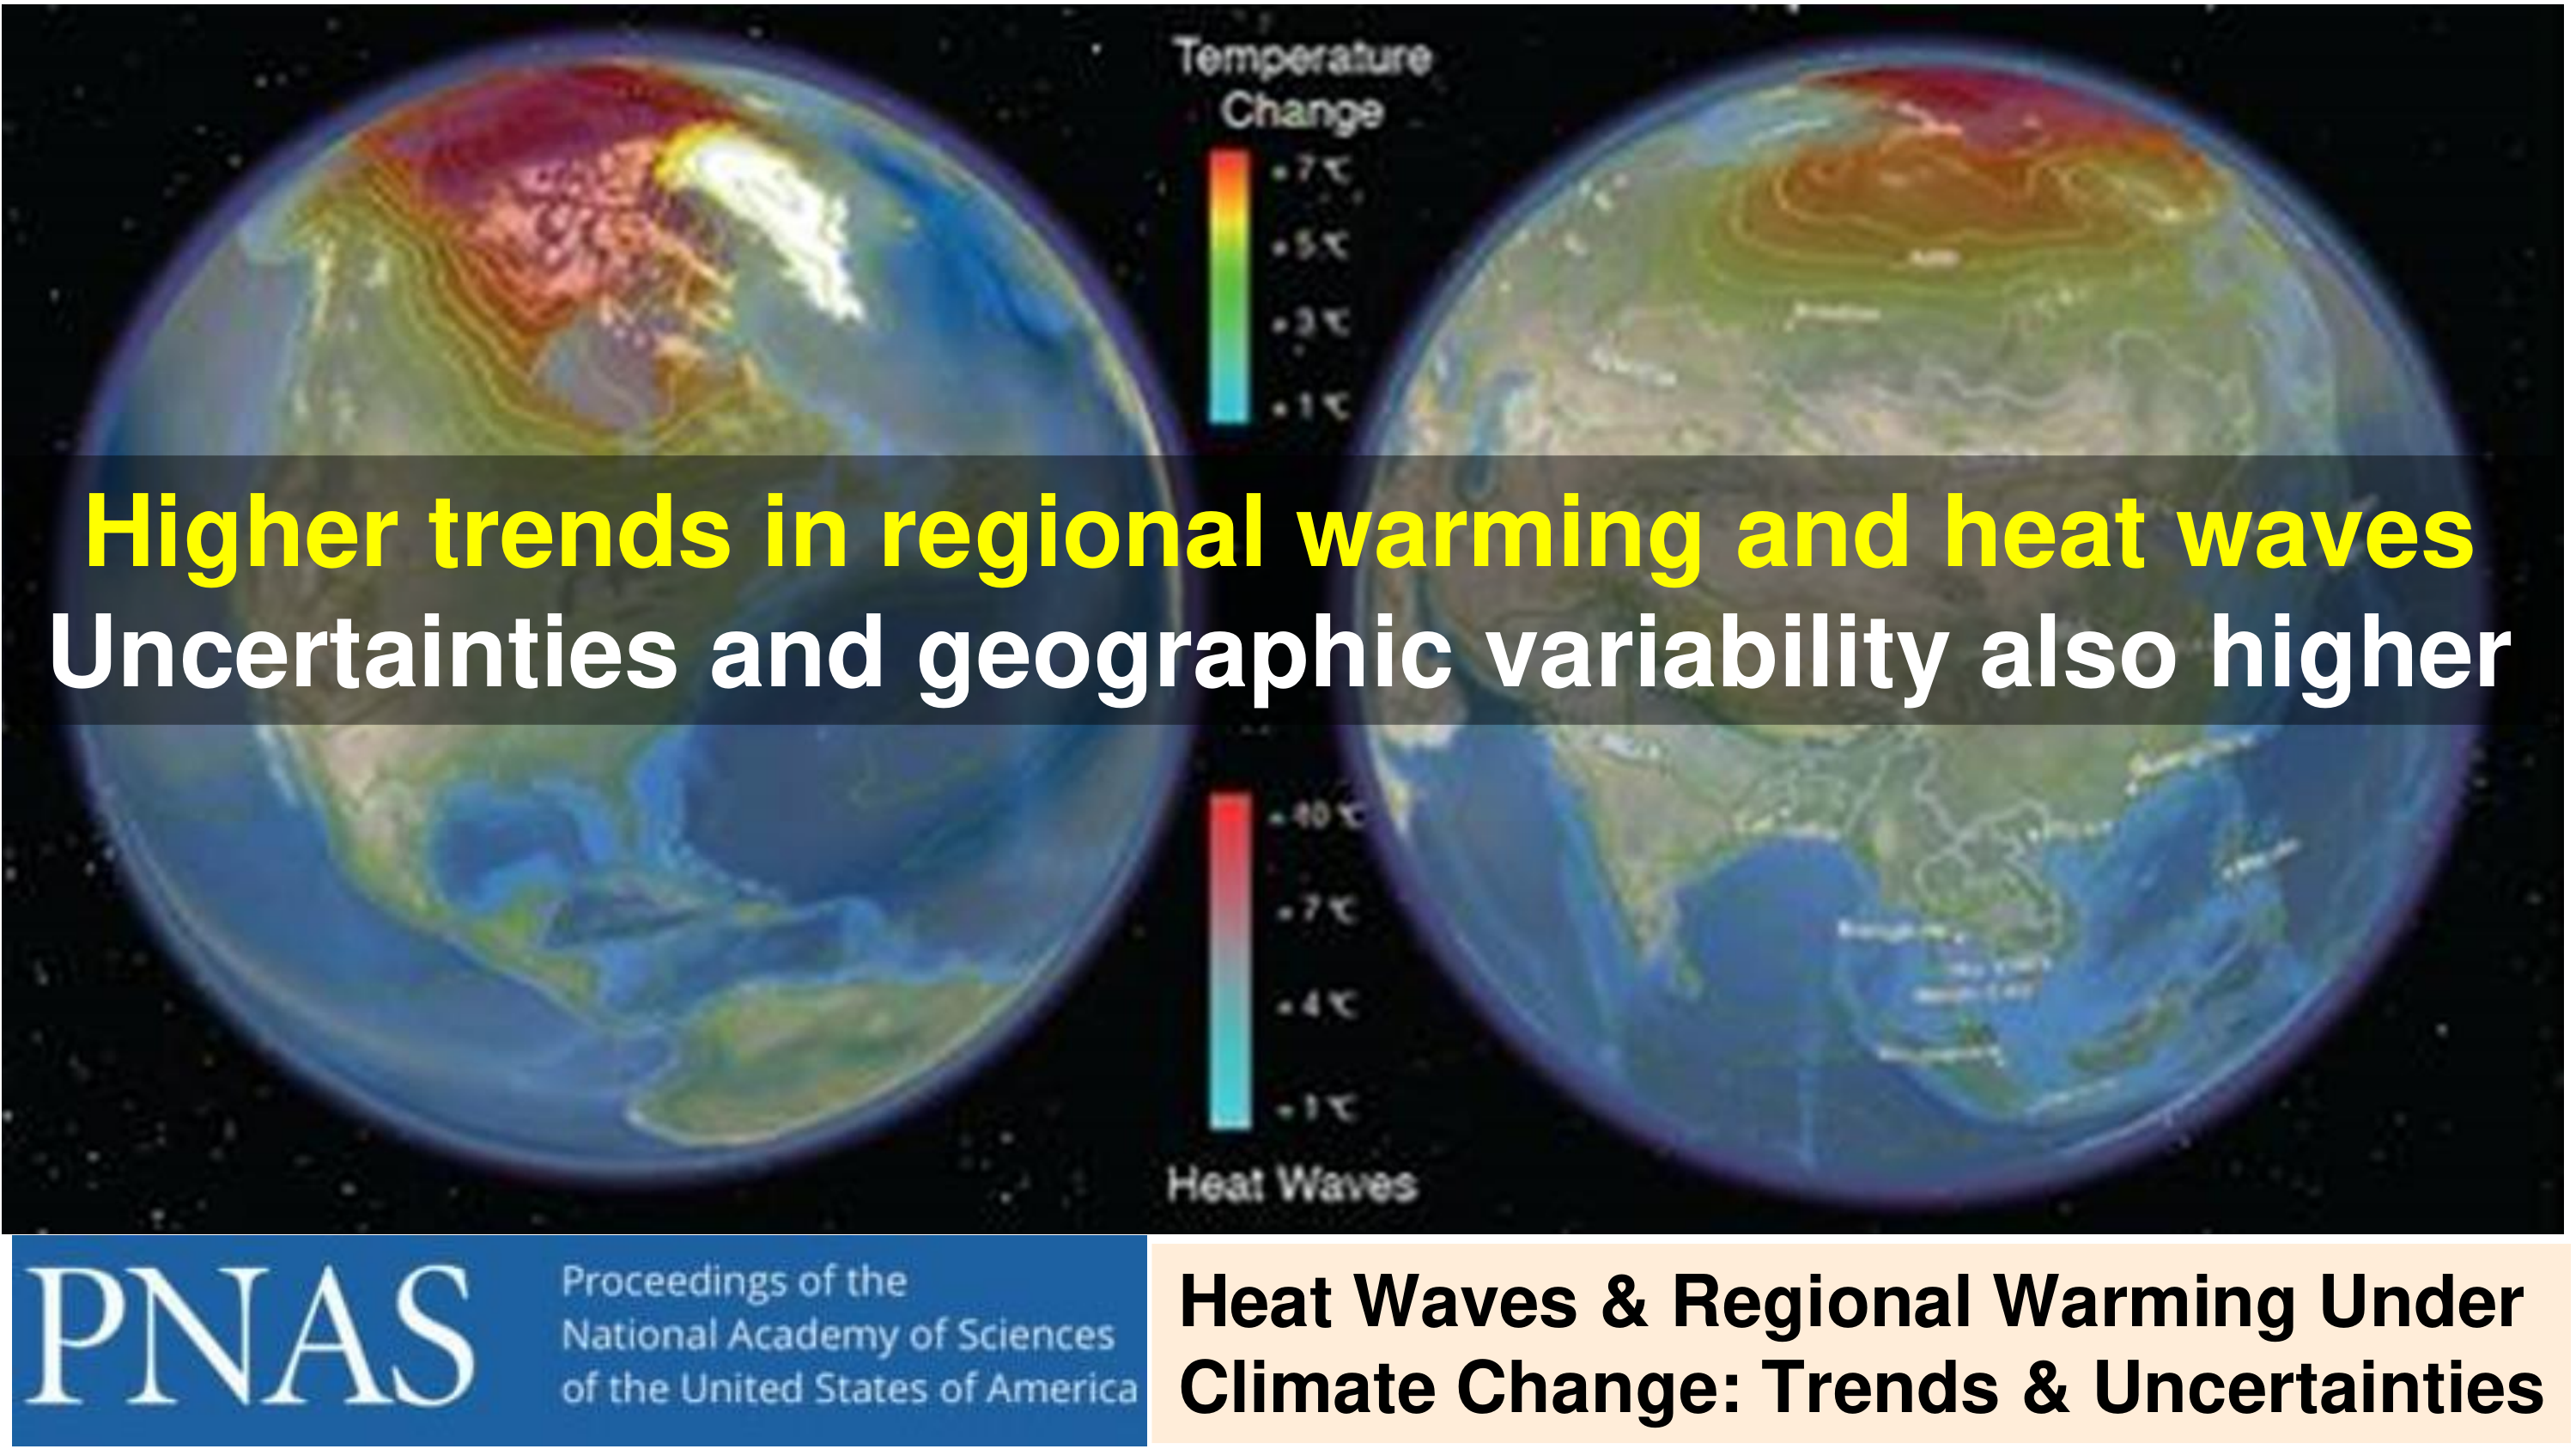
- Slide 2: Heat Waves and Climate Change
- PNAS paper: Ganguly, A.R., Steinhaeuser, K.*, Erickson, D.J., Branstetter, M., Parish, E.S., Singh, N., Drake, J.B. and Buja, L., 2009. Higher trends but larger uncertainty and geographic variability in 21st century temperature and heat waves . Proceedings of the National Academy of Sciences, 106(37), 15555-15559.
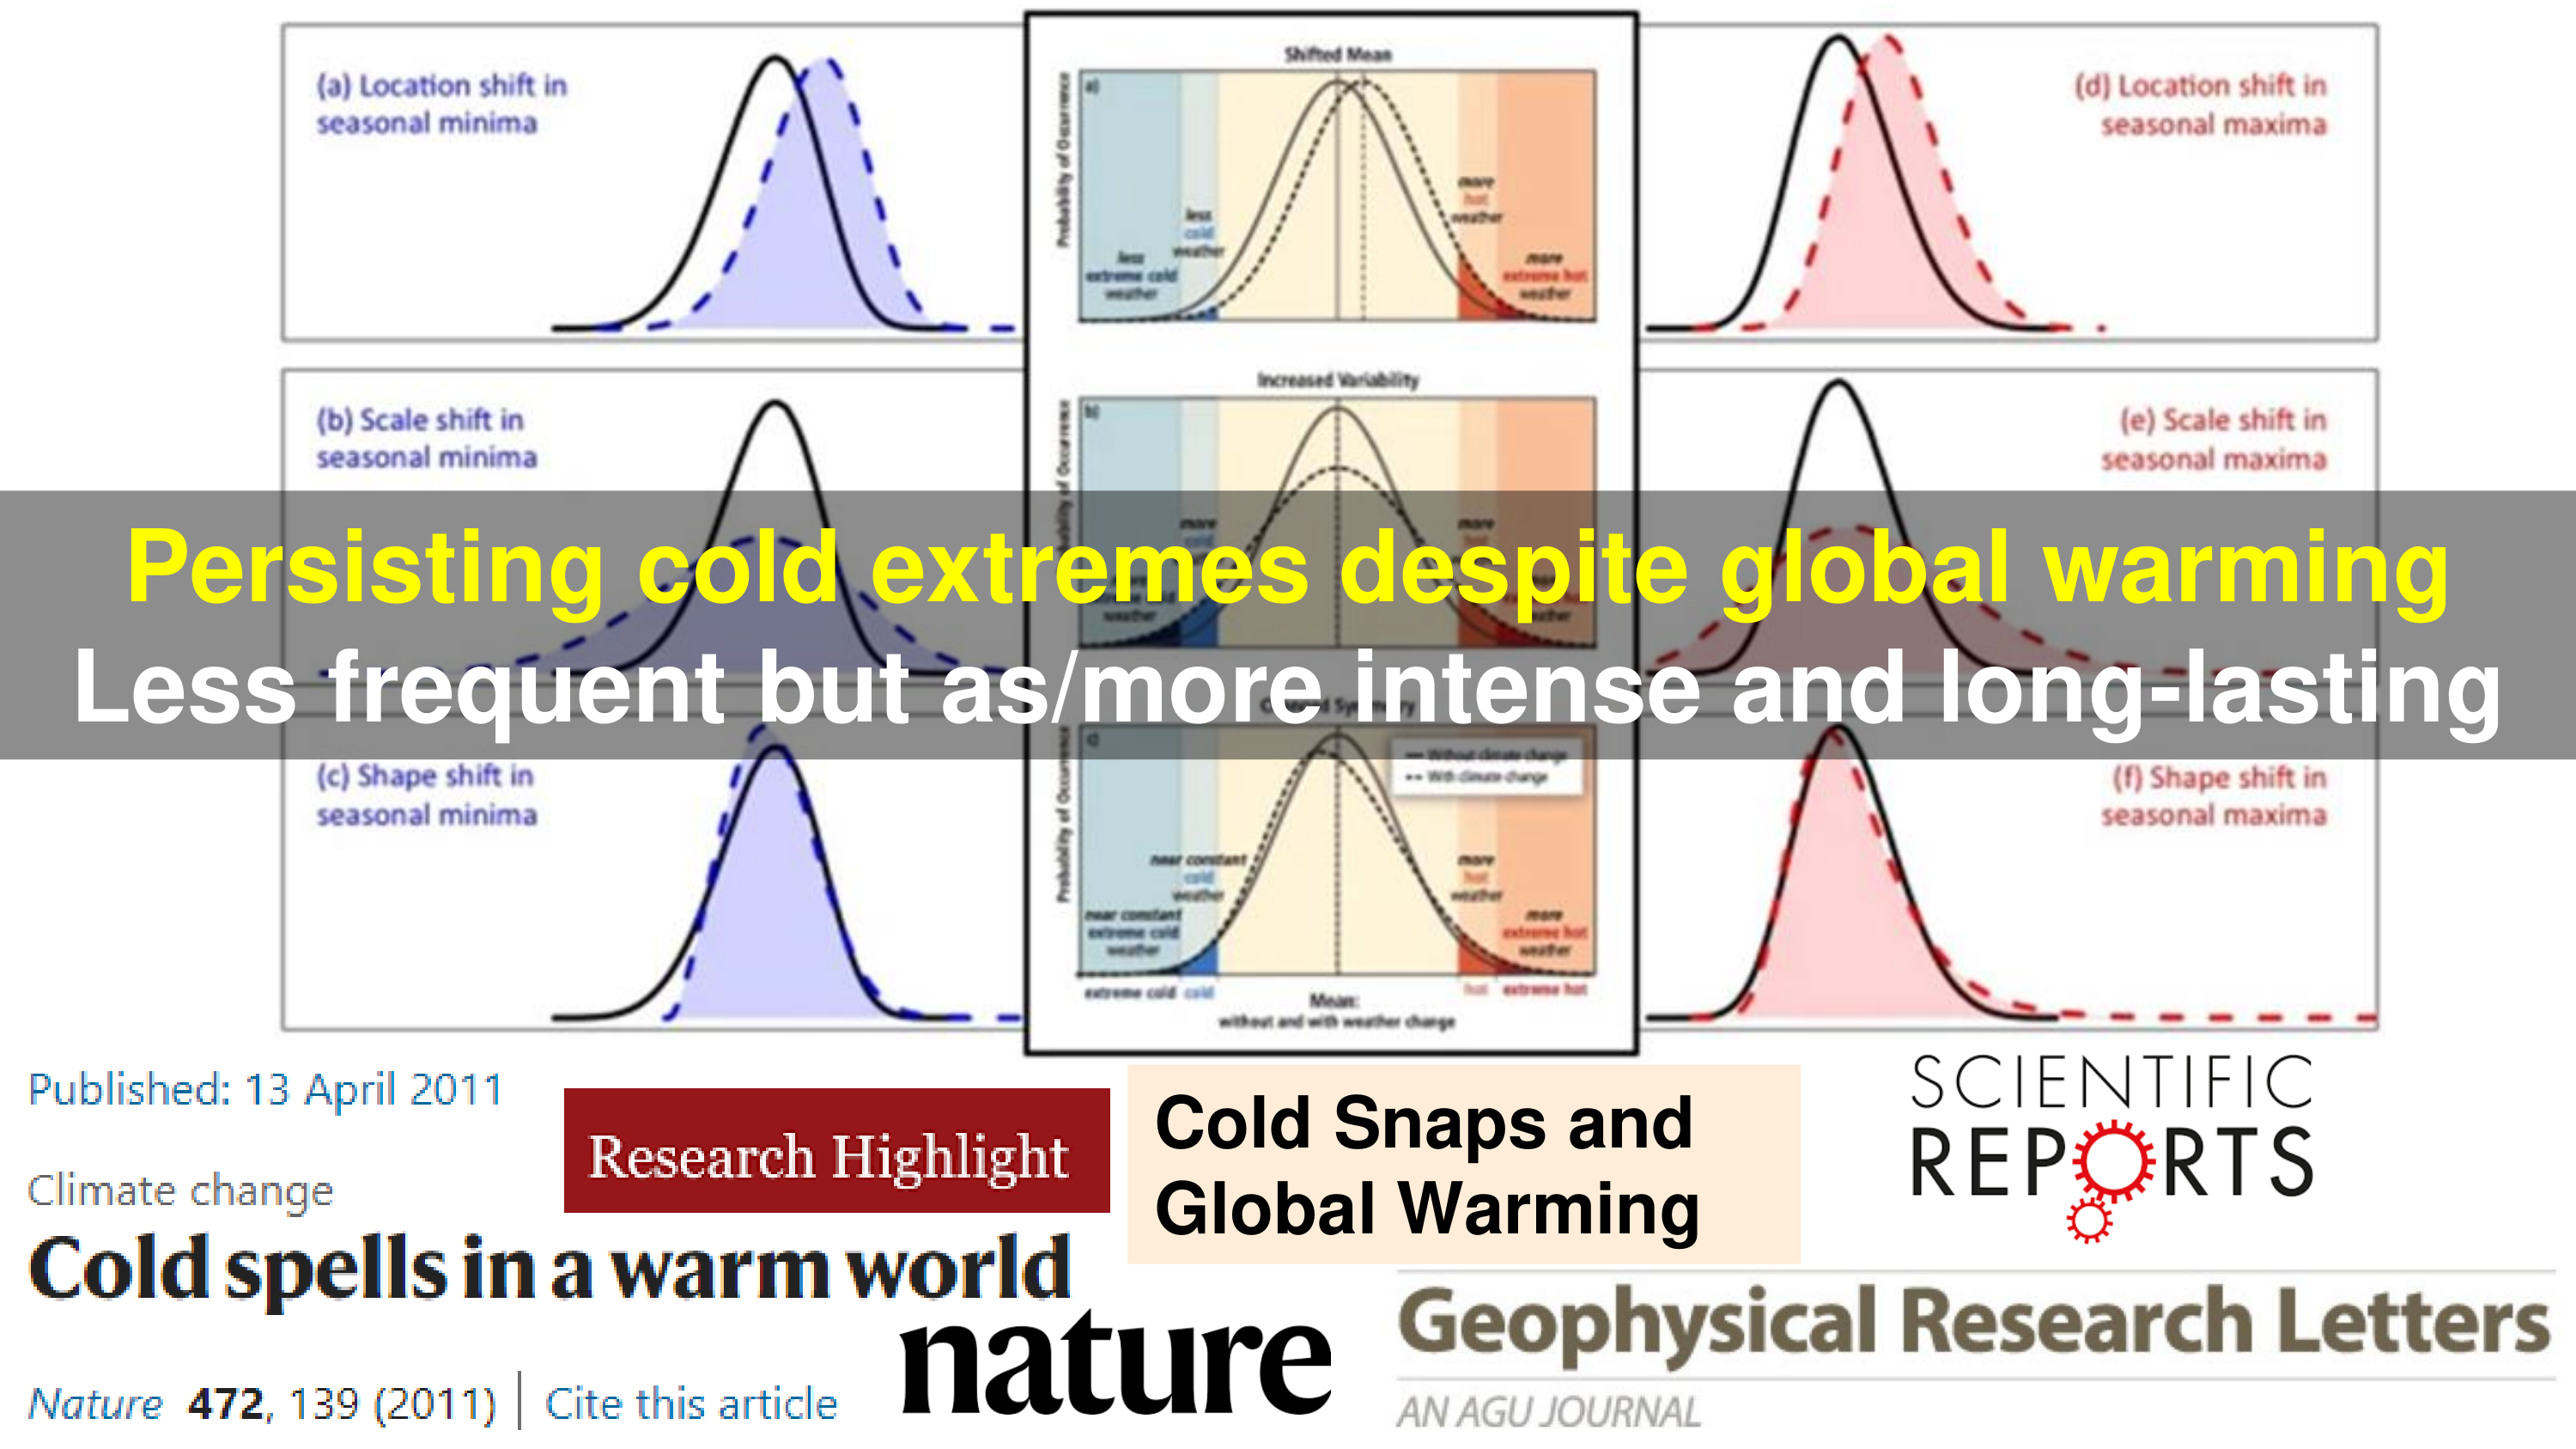
- Slide 3: Cold Snaps and Climate Change
- GRL paper: Kodra, E.*, Steinhaeuser, K.* and Ganguly, A.R., 2011. Persisting cold extremes under 21st ‐ century warming scenarios . Geophysical Research Letters, 38(8).
- Nature research highlight: Cold spells in a warm world. Nature 472, 139 (2011).
- Scientific Reports paper: Kodra, E.* and Ganguly, A.R., 2014. Asymmetry of projected increases in extreme temperature distributions . Scientific Reports, 4, 5884.
- Slide 4: Heavy Precipitation (Extremes) and Climate Change
- JGR paper: Kao, S.C.* and Ganguly, A.R., 2011. Intensity, duration, and frequency of precipitation extremes under 21st ‐ century warming scenarios . Journal of Geophysical Research: Atmospheres, 116(D16).
- Nature Climate Change paper: Ghosh, S.*, Das, D.*, Kao, S.C.* and Ganguly, A.R., 2012. Lack of uniform trends but increasing spatial variability in observed Indian rainfall extremes . Nature Climate Change, 2, 86-91.
- JGR paper: Mishra, V., Kumar, D.*, Ganguly, A.R., Sanjay, J., Mujumdar, M., Krishnan, R. and Shah, R.D., 2014. Reliability of regional and global climate models to simulate precipitation extremes over India . Journal of Geophysical Research: Atmospheres, 119(15), pp.9301-9323.
- Slide 5: Coastal Upwelling and Climate Change
- Nature paper: Wang, D.*, Gouhier, T.C., Menge, B.A. and Ganguly, A.R., 2015. Intensification and spatial homogenization of coastal upwelling under climate change . Nature, 518(7539), 390-394.
- Slide 6: Earth System Model Intercomparison and Internal Variability
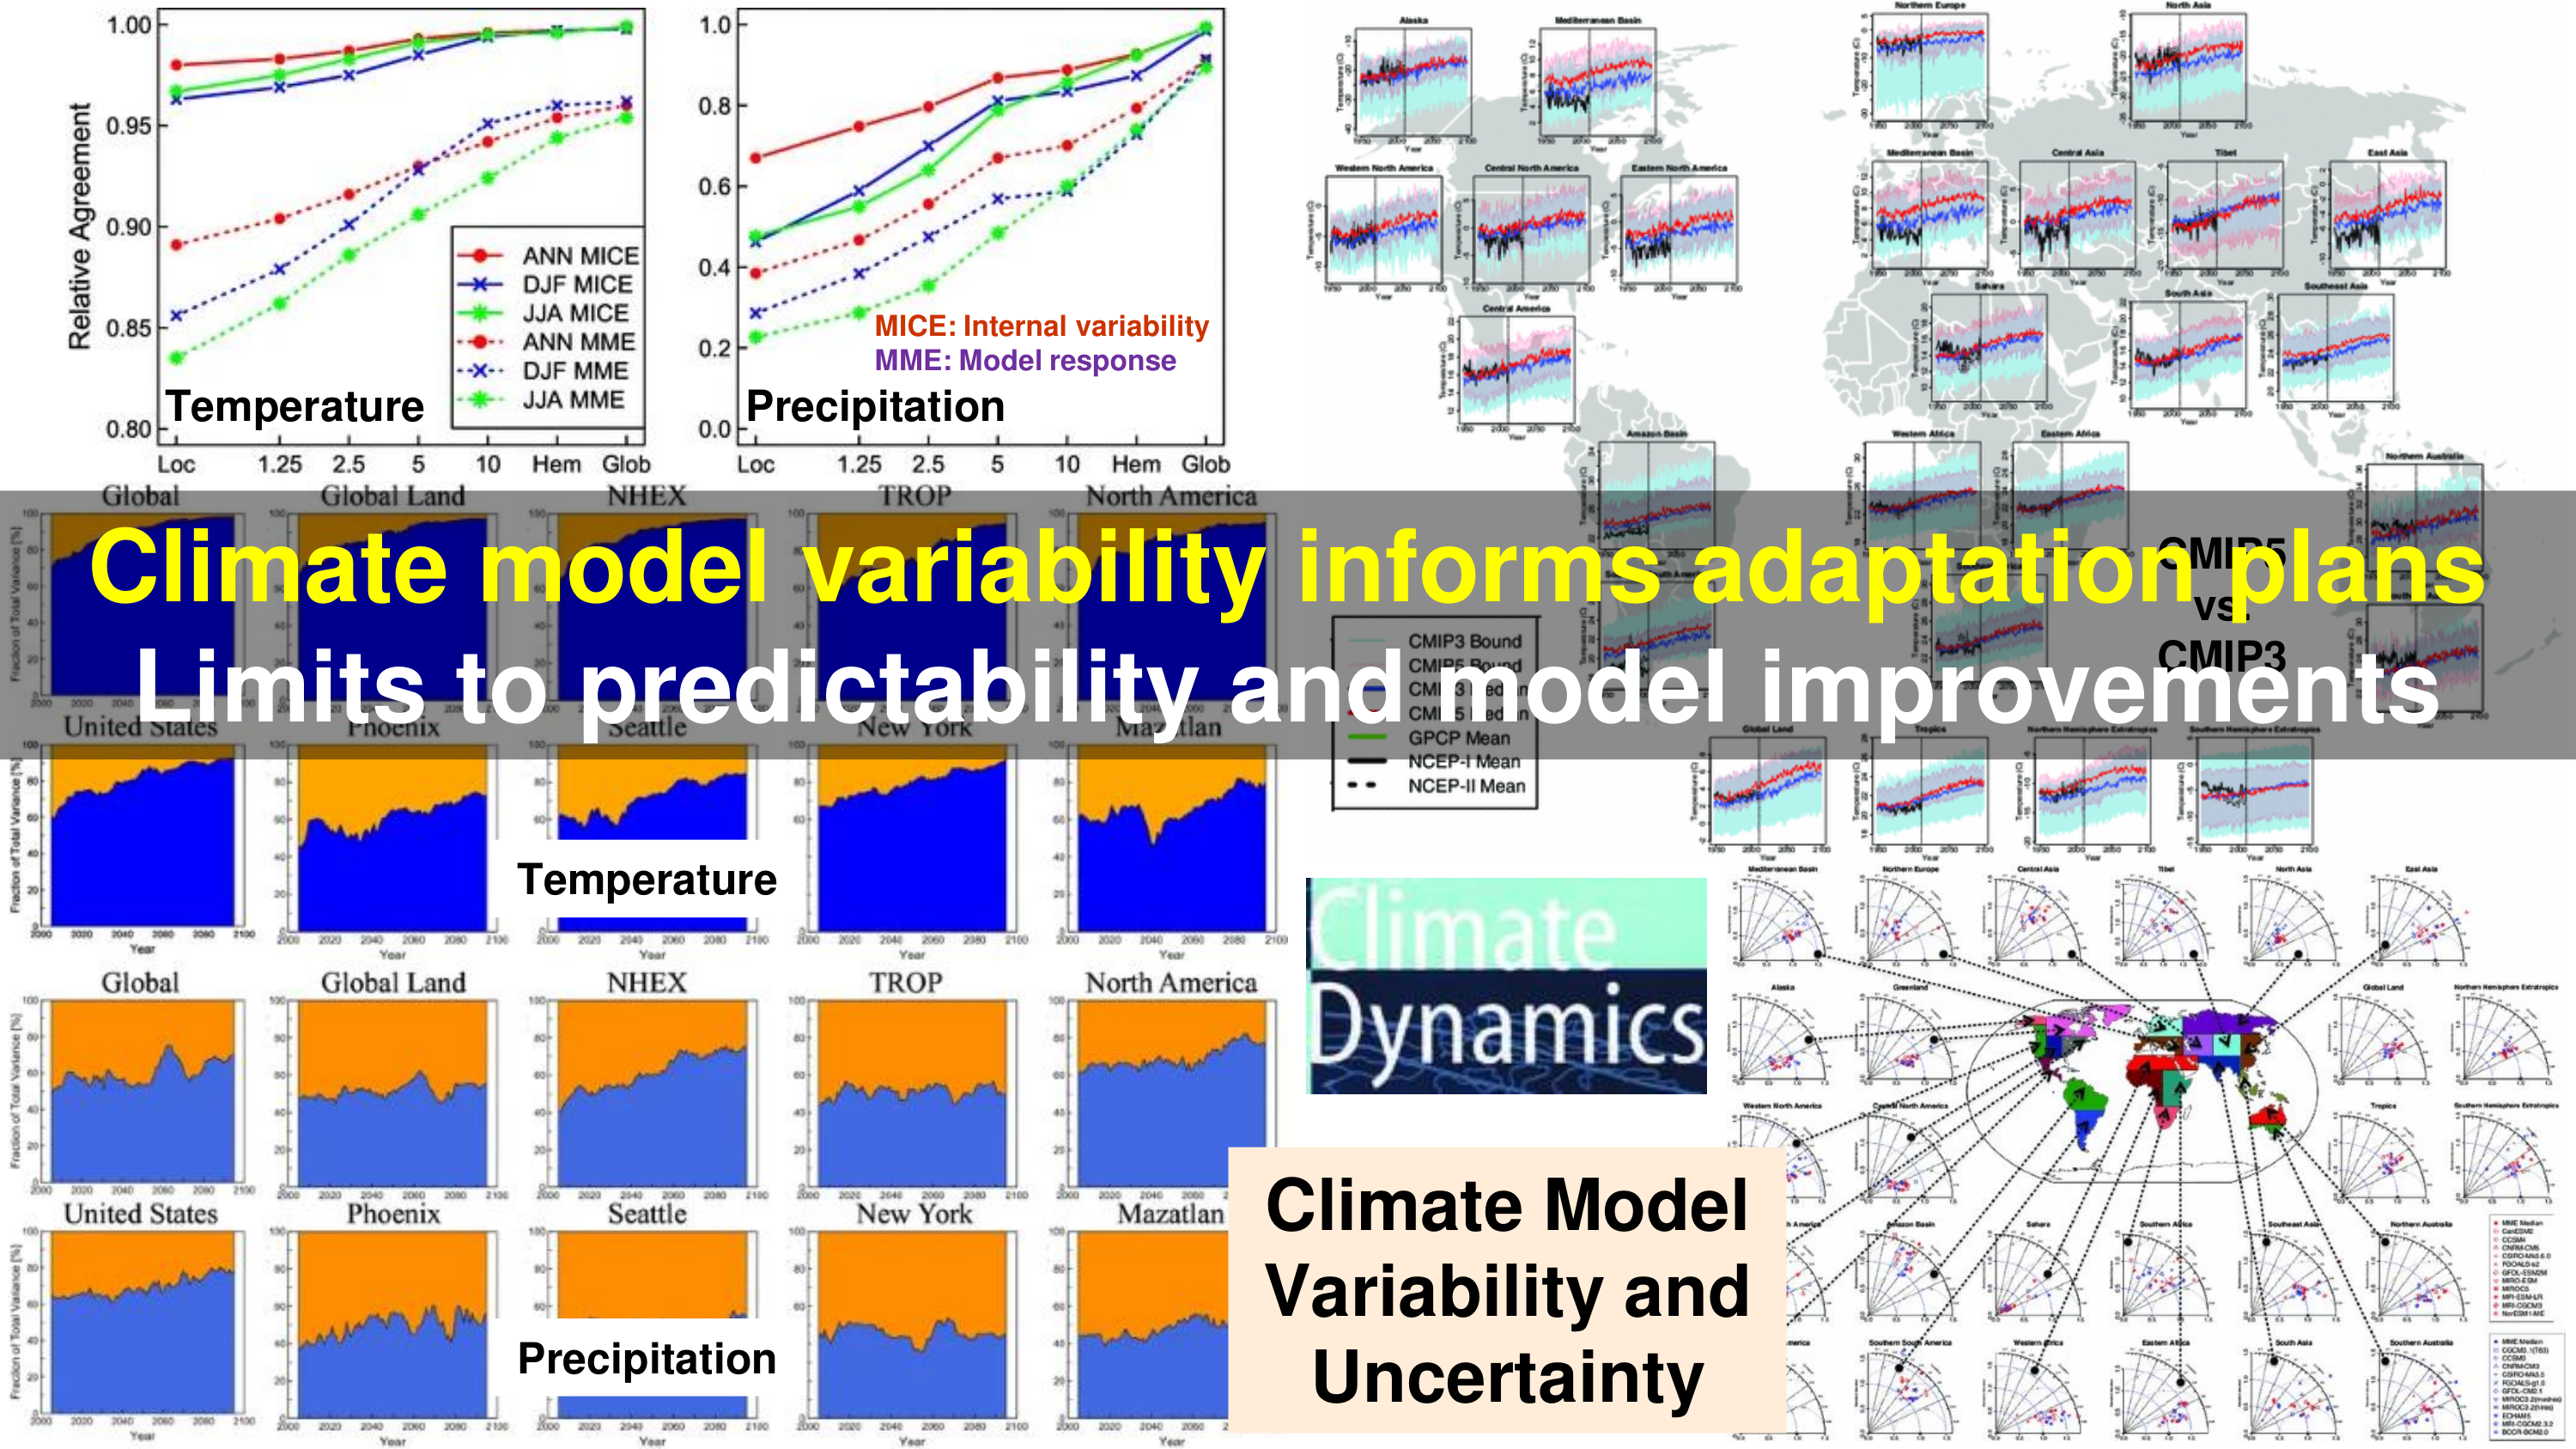
- Climate Dynamics paper: Kumar, D.* and Ganguly, A.R., 2018. Intercomparison of model response and internal variability across climate model ensembles . Climate Dynamics, 51(1), 207-219.
- Climate Dynamics paper: Kumar, D.*, Kodra, E.* and Ganguly, A.R., 2014. Regional and seasonal intercomparison of CMIP3 and CMIP5 climate model ensembles for temperature and precipitation . Climate Dynamics, 43(9-10), 2491-2518.
- Slide 7: Climate Teleconnections and Complex Dependence
- Climate Dynamics paper: Steinhaeuser, K.*, Ganguly, A.R. and Chawla, N.V., 2012. Multivariate and multiscale dependence in the global climate system revealed through complex networks . Climate Dynamics, 39(3-4), 889-895.
- SADM paper: Steinhaeuser, K.*, Chawla, N.V. and Ganguly, A.R., 2011. Complex networks as a unified framework for descriptive analysis and predictive modeling in climate science . Statistical Analysis and Data Mining: The ASA Data Science Journal, 4(5), 497-511.
- J. Climate paper: Liess, S., Kumar, A., Snyder, P.K., Kawale, J., Steinhaeuser, K., Semazzi, F.H.M., Ganguly, A.R., Samatova, N.F. and Kumar, V., 2014. Different Modes of Variability over the Tasman Sea: Implications for Regional Climate . Journal of Climate, 27(22), 8466–8486.
- Nature news (citation 2 of 3): Jones, N., 2017. How machine learning could help to improve climate forecasts . Nature 548, 379.
- SADM paper: Kawale, J., Liess, S., Kumar, A., Steinbach, M., Snyder, P., Kumar, V., Ganguly, A.R., Samatova, N.F., Semazzi, F, 2011. A graph-based approach to find teleconnections in climate data . Statistical Analysis and Data Mining: The ASA Data Science Journal, 6(3), 158-179.
- ERL paper: Kodra, E.*, Ghosh, S.* and Ganguly, A.R., 2012. Evaluation of global climate models for Indian monsoon climatology . Environmental Research Letters, 7(1), p.014012.
- GRL paper: Khan, S.*, Ganguly, A.R., Bandyopadhyay, S., Saigal, S., Erickson III, D.J., Protopopescu, V. and Ostrouchov, G., 2006. Nonlinear statistics reveals stronger ties between ENSO and the tropical hydrological cycle . Geophysical Research Letters, 33(24).
- PRE paper: Khan, S.*, Bandyopadhyay, S., Ganguly, A.R., Saigal, S., Erickson III, D.J., Protopopescu, V. and Ostrouchov, G., 2007. Relative performance of mutual information estimation methods for quantifying the dependence among short and noisy data . Physical Review E, 76(2), p.026209.
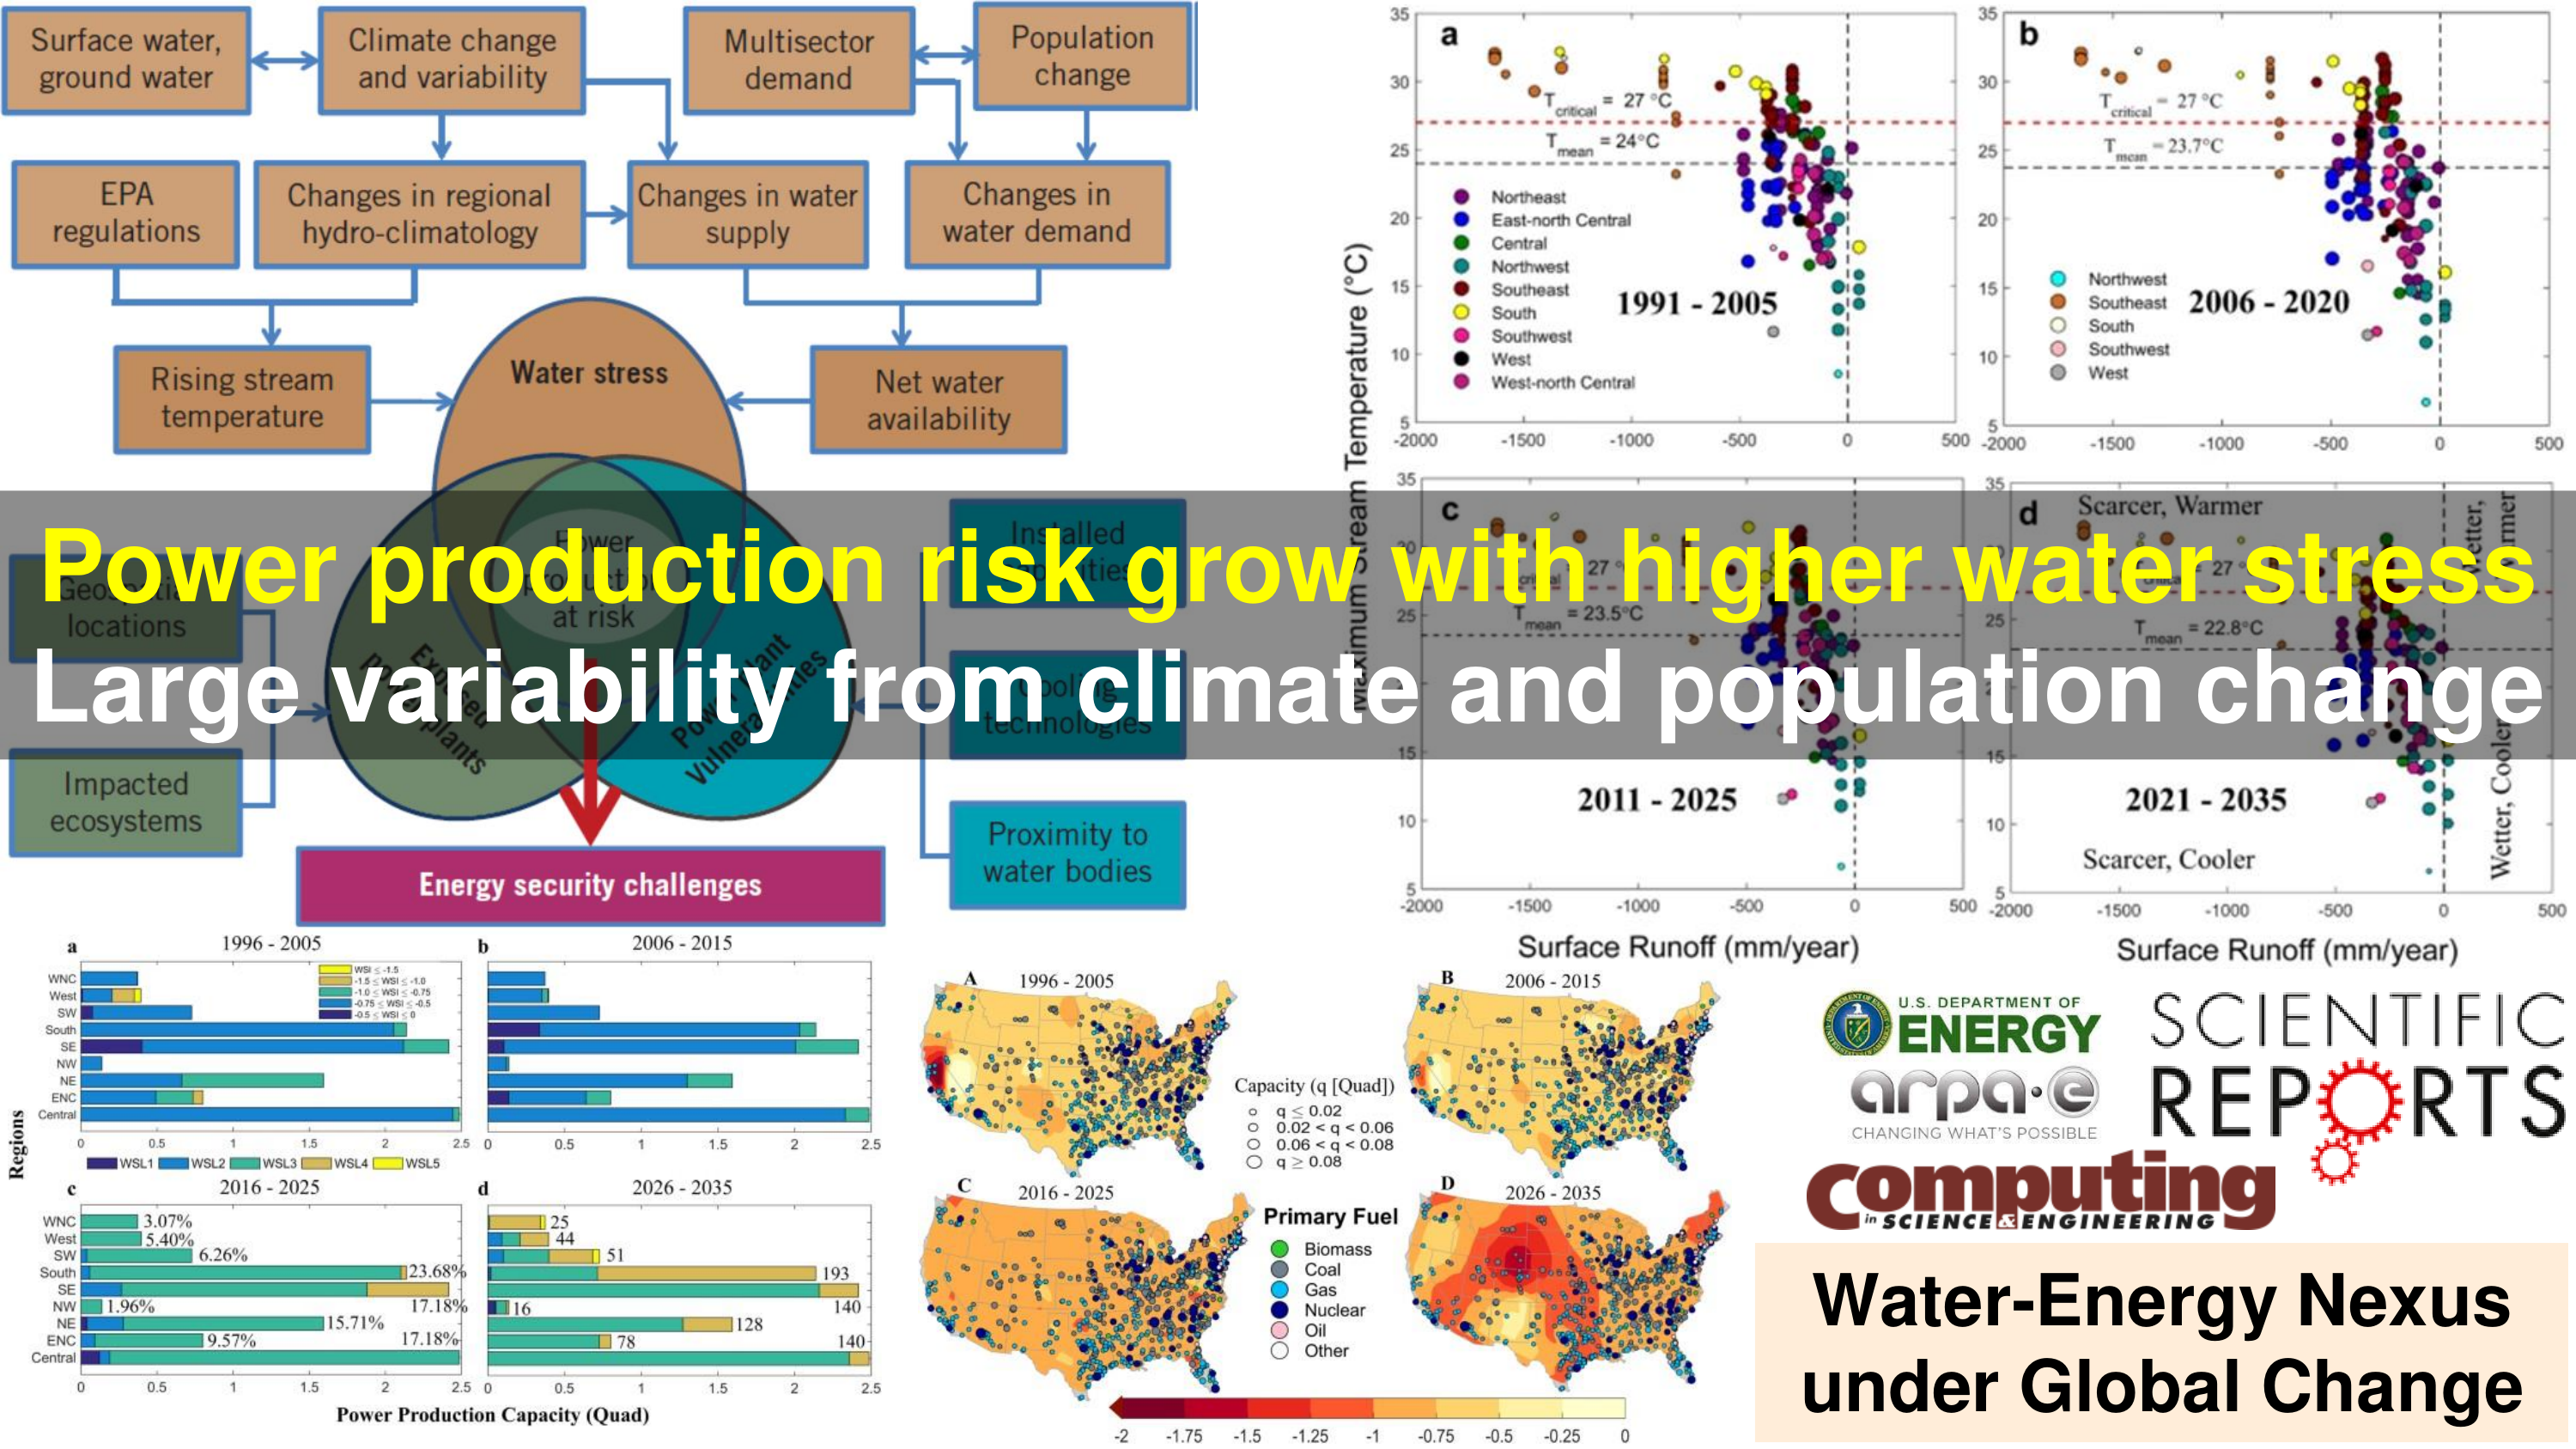
- Slide 8: Climate-Water-Energy Nexus and Climate Adaptation Informatics
- Scientific Reports paper: Ganguli, P.*, Kumar, D.* and Ganguly, A.R., 2017. US power production at risk from water stress in a changing climate . Scientific Reports, 7(1), 11983.
- CiSE paper: Ganguly, A.R., Kumar, D.*, Ganguli, P.*, Short, G. and Klausner, J., 2015. Climate adaptation informatics: water stress on power production . Computing in Science & Engineering, 17(6), pp.53-60.
- ARPA-E FoA: Ganguli, P.*, Kumar, D.* and Ganguly, A.R., 2014: Water Stress on US Power Production at Decadal Time Horizons . Advanced Research Projects Agency – Energy, #DE-AR0000482, 81 pages.
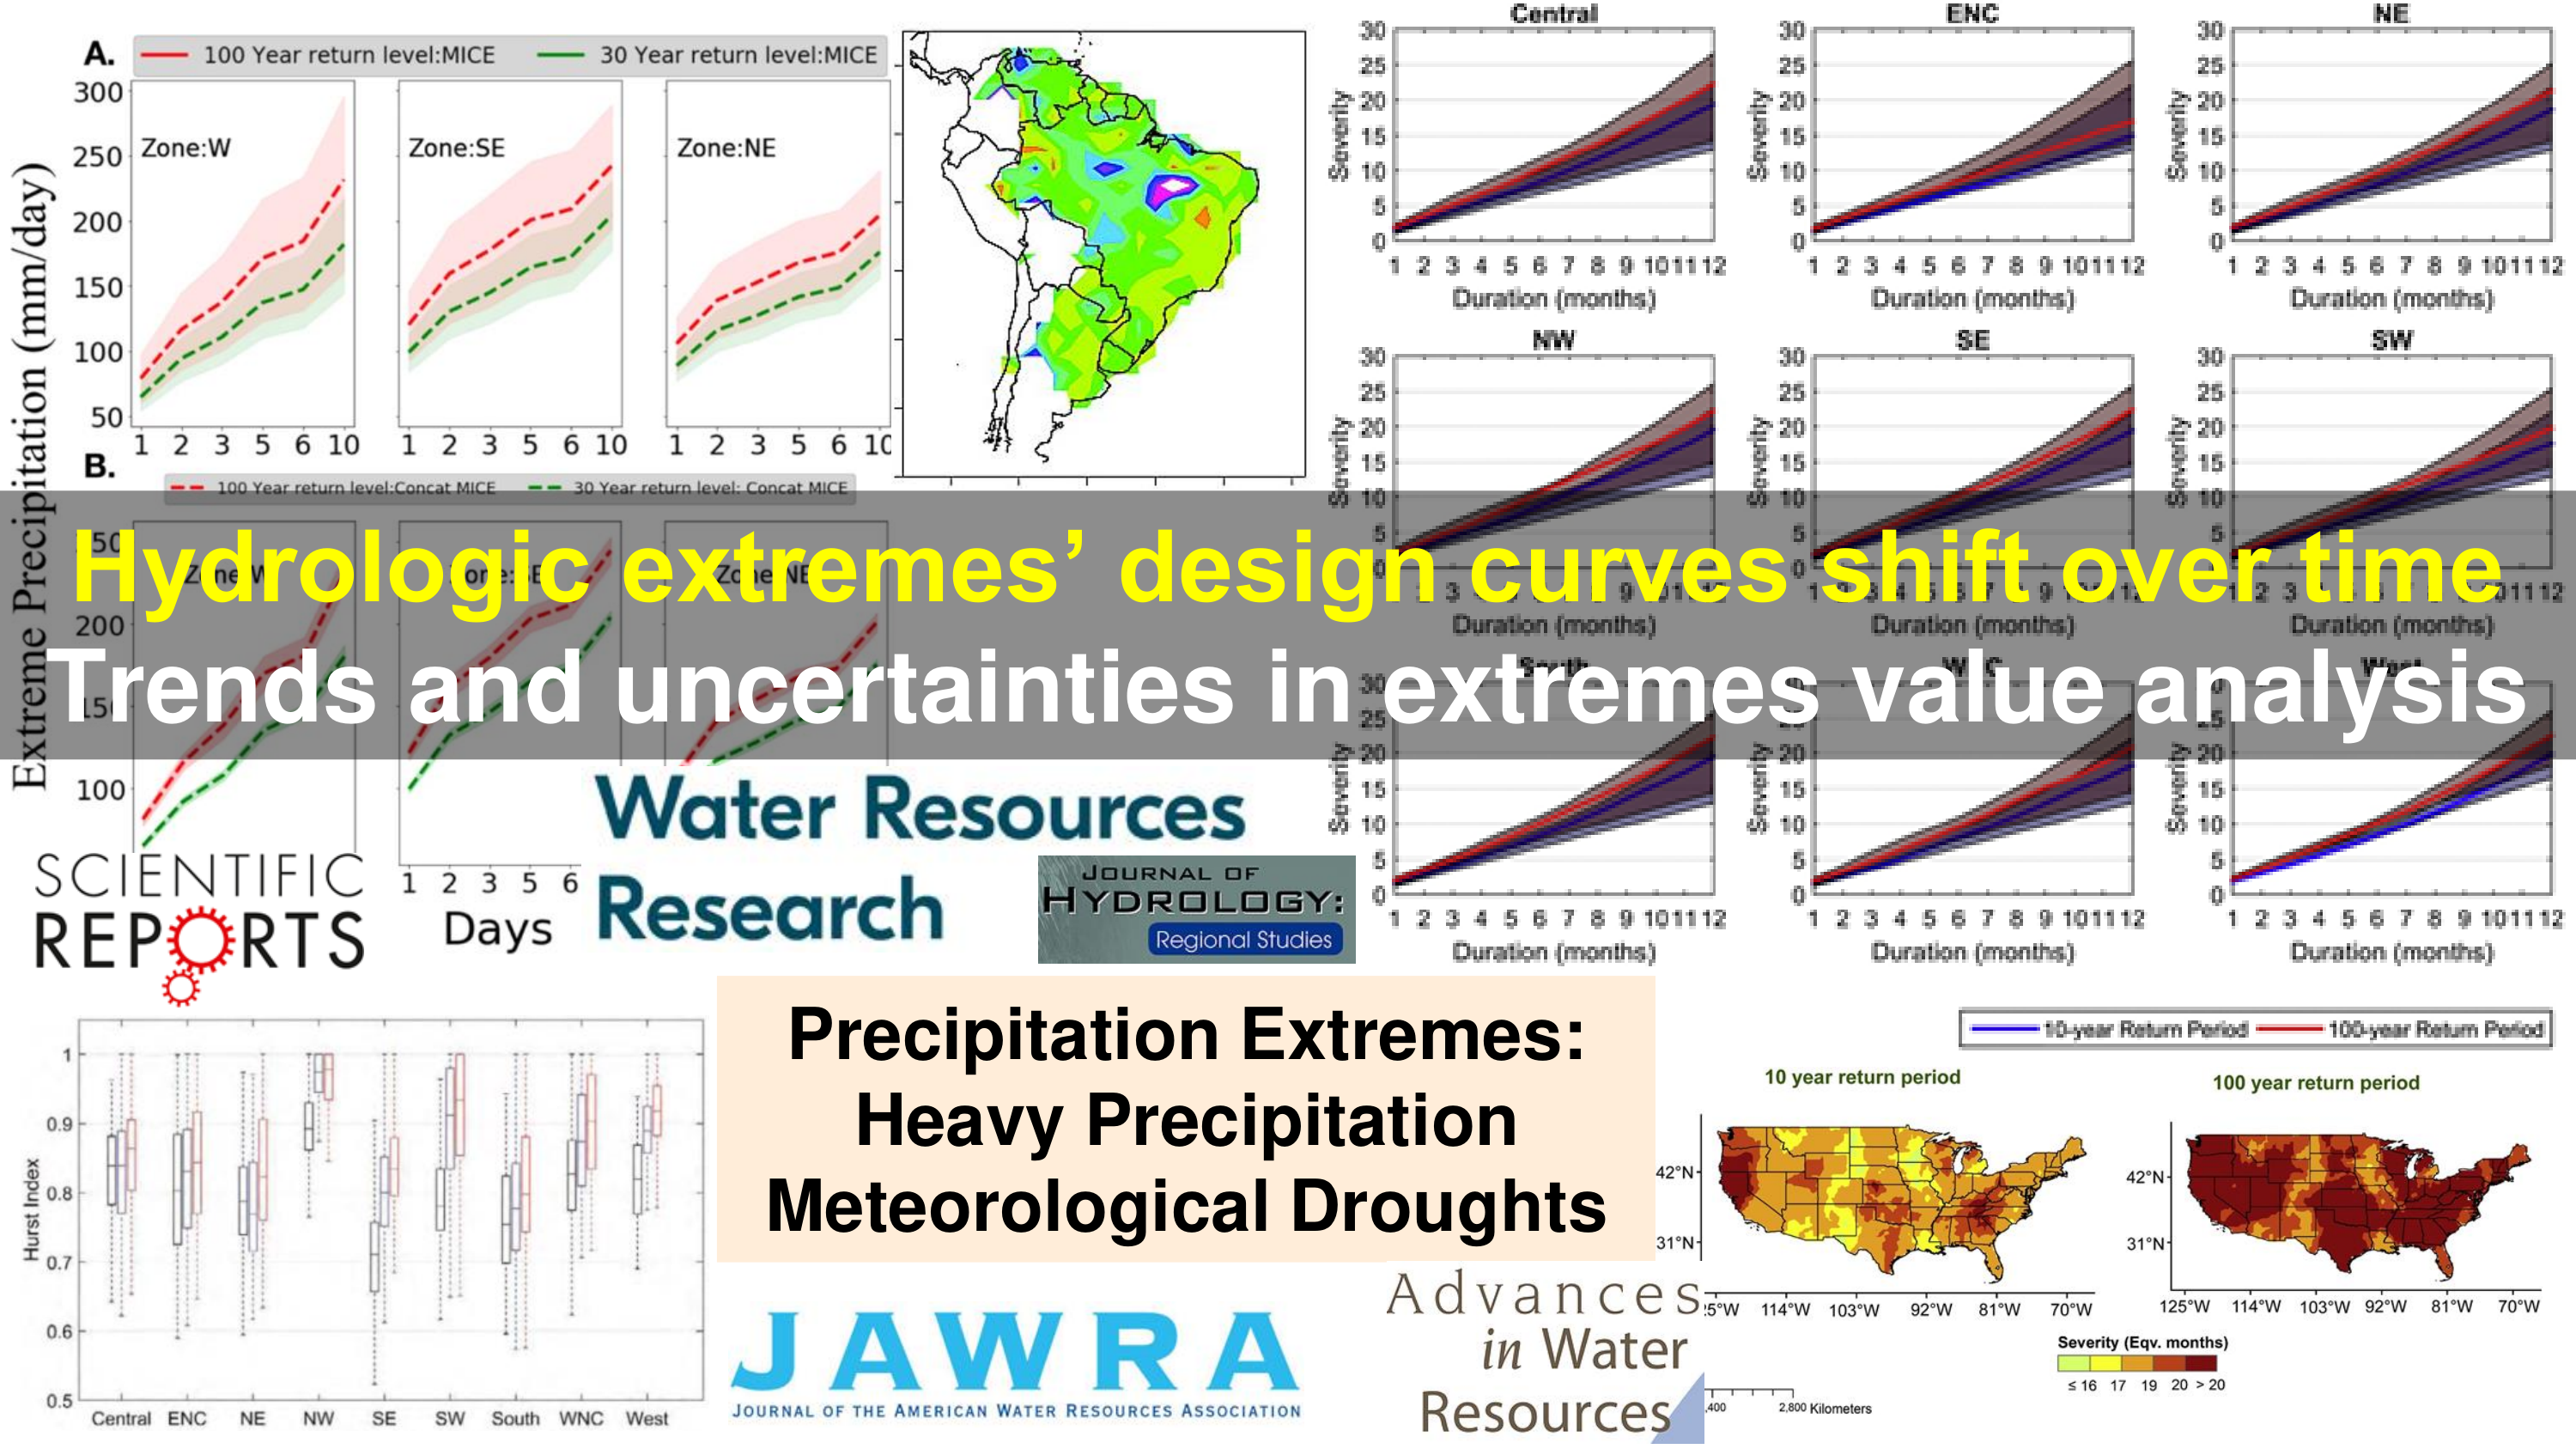
- Slide 9: Hydrometeorological Extremes and Design Curves with Extreme Value Statistics
- SREP paper: Bhatia, U.* and Ganguly, A.R., 2019. Precipitation extremes and depth-duration-frequency under internal climate variability . Scientific Reports, 9(1), 9112.
- JAWRA paper: Ganguli, P.* and Ganguly, A.R., 2016. Robustness of meteorological droughts in dynamically downscaled climate simulations . JAWRA Journal of the American Water Resources Association, 52(1), pp.138-167.
- JH paper: Ganguli, P.* and Ganguly, A.R., 2016. Space-time trends in US meteorological droughts . Journal of Hydrology: Regional Studies, 8, pp.235-259.
- Climate Dynamics paper: Kumar, D.*, Mishra, V.* and Ganguly, A.R., 2015. Evaluating wind extremes in CMIP5 climate models . Climate Dynamics, 45(1), pp.441-453.
- AWR paper: Kuhn, G.*, Khan, S.*, Ganguly, A.R. and Branstetter, M.L., 2007. Geospatial–temporal dependence among weekly precipitation extremes with applications to observations and climate model simulations in South America . Advances in Water Resources, 30(12), pp.2401-2423.
- AWR paper: Malakar, P., Mukherjee, A., Bhanja, S.N., Ganguly, A.R., Ray, R.K., Zahid, A., Sarkar, S., Saha, D. and Chattopadhyay, S., 2021. Three decades of depth-dependent groundwater response to climate variability and human regime in the transboundary Indus-Ganges-Brahmaputra-Meghna mega river basin aquifers . Advances in Water Resources, 149, p.103856.
- WRR paper: Khan, S.*, Kuhn, G.*, Ganguly, A.R., Erickson III, D.J. and Ostrouchov, G., 2007. Spatio‐temporal variability of daily and weekly precipitation extremes in South America . Water Resources Research, 43(11).
- Slide 10: Remote Sensing and Spatiotemporal Machine Learning
- RSE paper: Konduri, V.S.*, Kumar, J., Hargrove, W.W., Hoffman, F.M. and Ganguly, A.R., 2020. Mapping crops within the growing season across the United States . Remote Sensing of Environment, 251, p.112048.
- Frontiers paper: Duffy, K.*, Vandal, T.*, Li, S., Ganguly, S., Nemani, R. and Ganguly, A.R., 2019. DeepEmSat: Deep Emulation for Satellite Data Mining . Frontiers in Big Data, 2, p.42.
- Frontiers paper: Konduri, V.S.*, Vandal, T.J.*, Ganguly, S. and Ganguly, A.R., 2020. Data science for weather impacts on crop yield . Frontiers in Sustainable Food Systems, 4, p.52.
- RSL paper: Collier, E., Mukhopadhyay, S., Duffy, K.*, Ganguly, S., Madanguit, G., Kalia, S., Shreekant, G., Nemani, R., Michaelis, A., Li, S. and Ganguly, A., 2021. Semantic Segmentation of High Resolution Satellite Imagery using Generative Adversarial Networks with Progressive Growing . Remote Sensing Letters, 12(5), pp.439-448.
- Slide 11: Resilience of Regional Transportation Systems with Network Science
- IEEE Transactions ITS paper: Clark, K.L.*, Bhatia, U.*, Kodra, E.A.* and Ganguly, A.R., 2018. Resilience of the US national airspace system airport network . IEEE Transactions on Intelligent Transportation Systems, 19(12), pp.3785-3794.
- PLOS ONE paper: Bhatia, U.*, Kumar, D.*, Kodra, E.* and Ganguly, A.R., 2015. Network science based quantification of resilience demonstrated on the indian railways network . PLOS ONE, 10(11), p.e0141890.
- Slide 12: Urban Climate Extremes and Multi-hazards Transportation Resilience
- SREP paper: Yadav, N.*, Chatterjee, S. and Ganguly, A.R., 2020. Resilience of urban transport network-of-networks under intense flood hazards exacerbated by targeted attacks . Scientific Reports, 10(1), 10350.
- ERL paper: Mishra, V.*, Ganguly, A.R., Nijssen, B. and Lettenmaier, D.P., 2015. Changes in observed climate extremes in global urban areas . Environmental Research Letters, 10(2), p.024005.
- ASCE JIS paper: Bhatia, U.*, Sela, L. and Ganguly, A.R., 2020. Hybrid method of recovery: combining topology and optimization for transportation systems . ASCE Journal of Infrastructure Systems, 26(3), p.04020024.
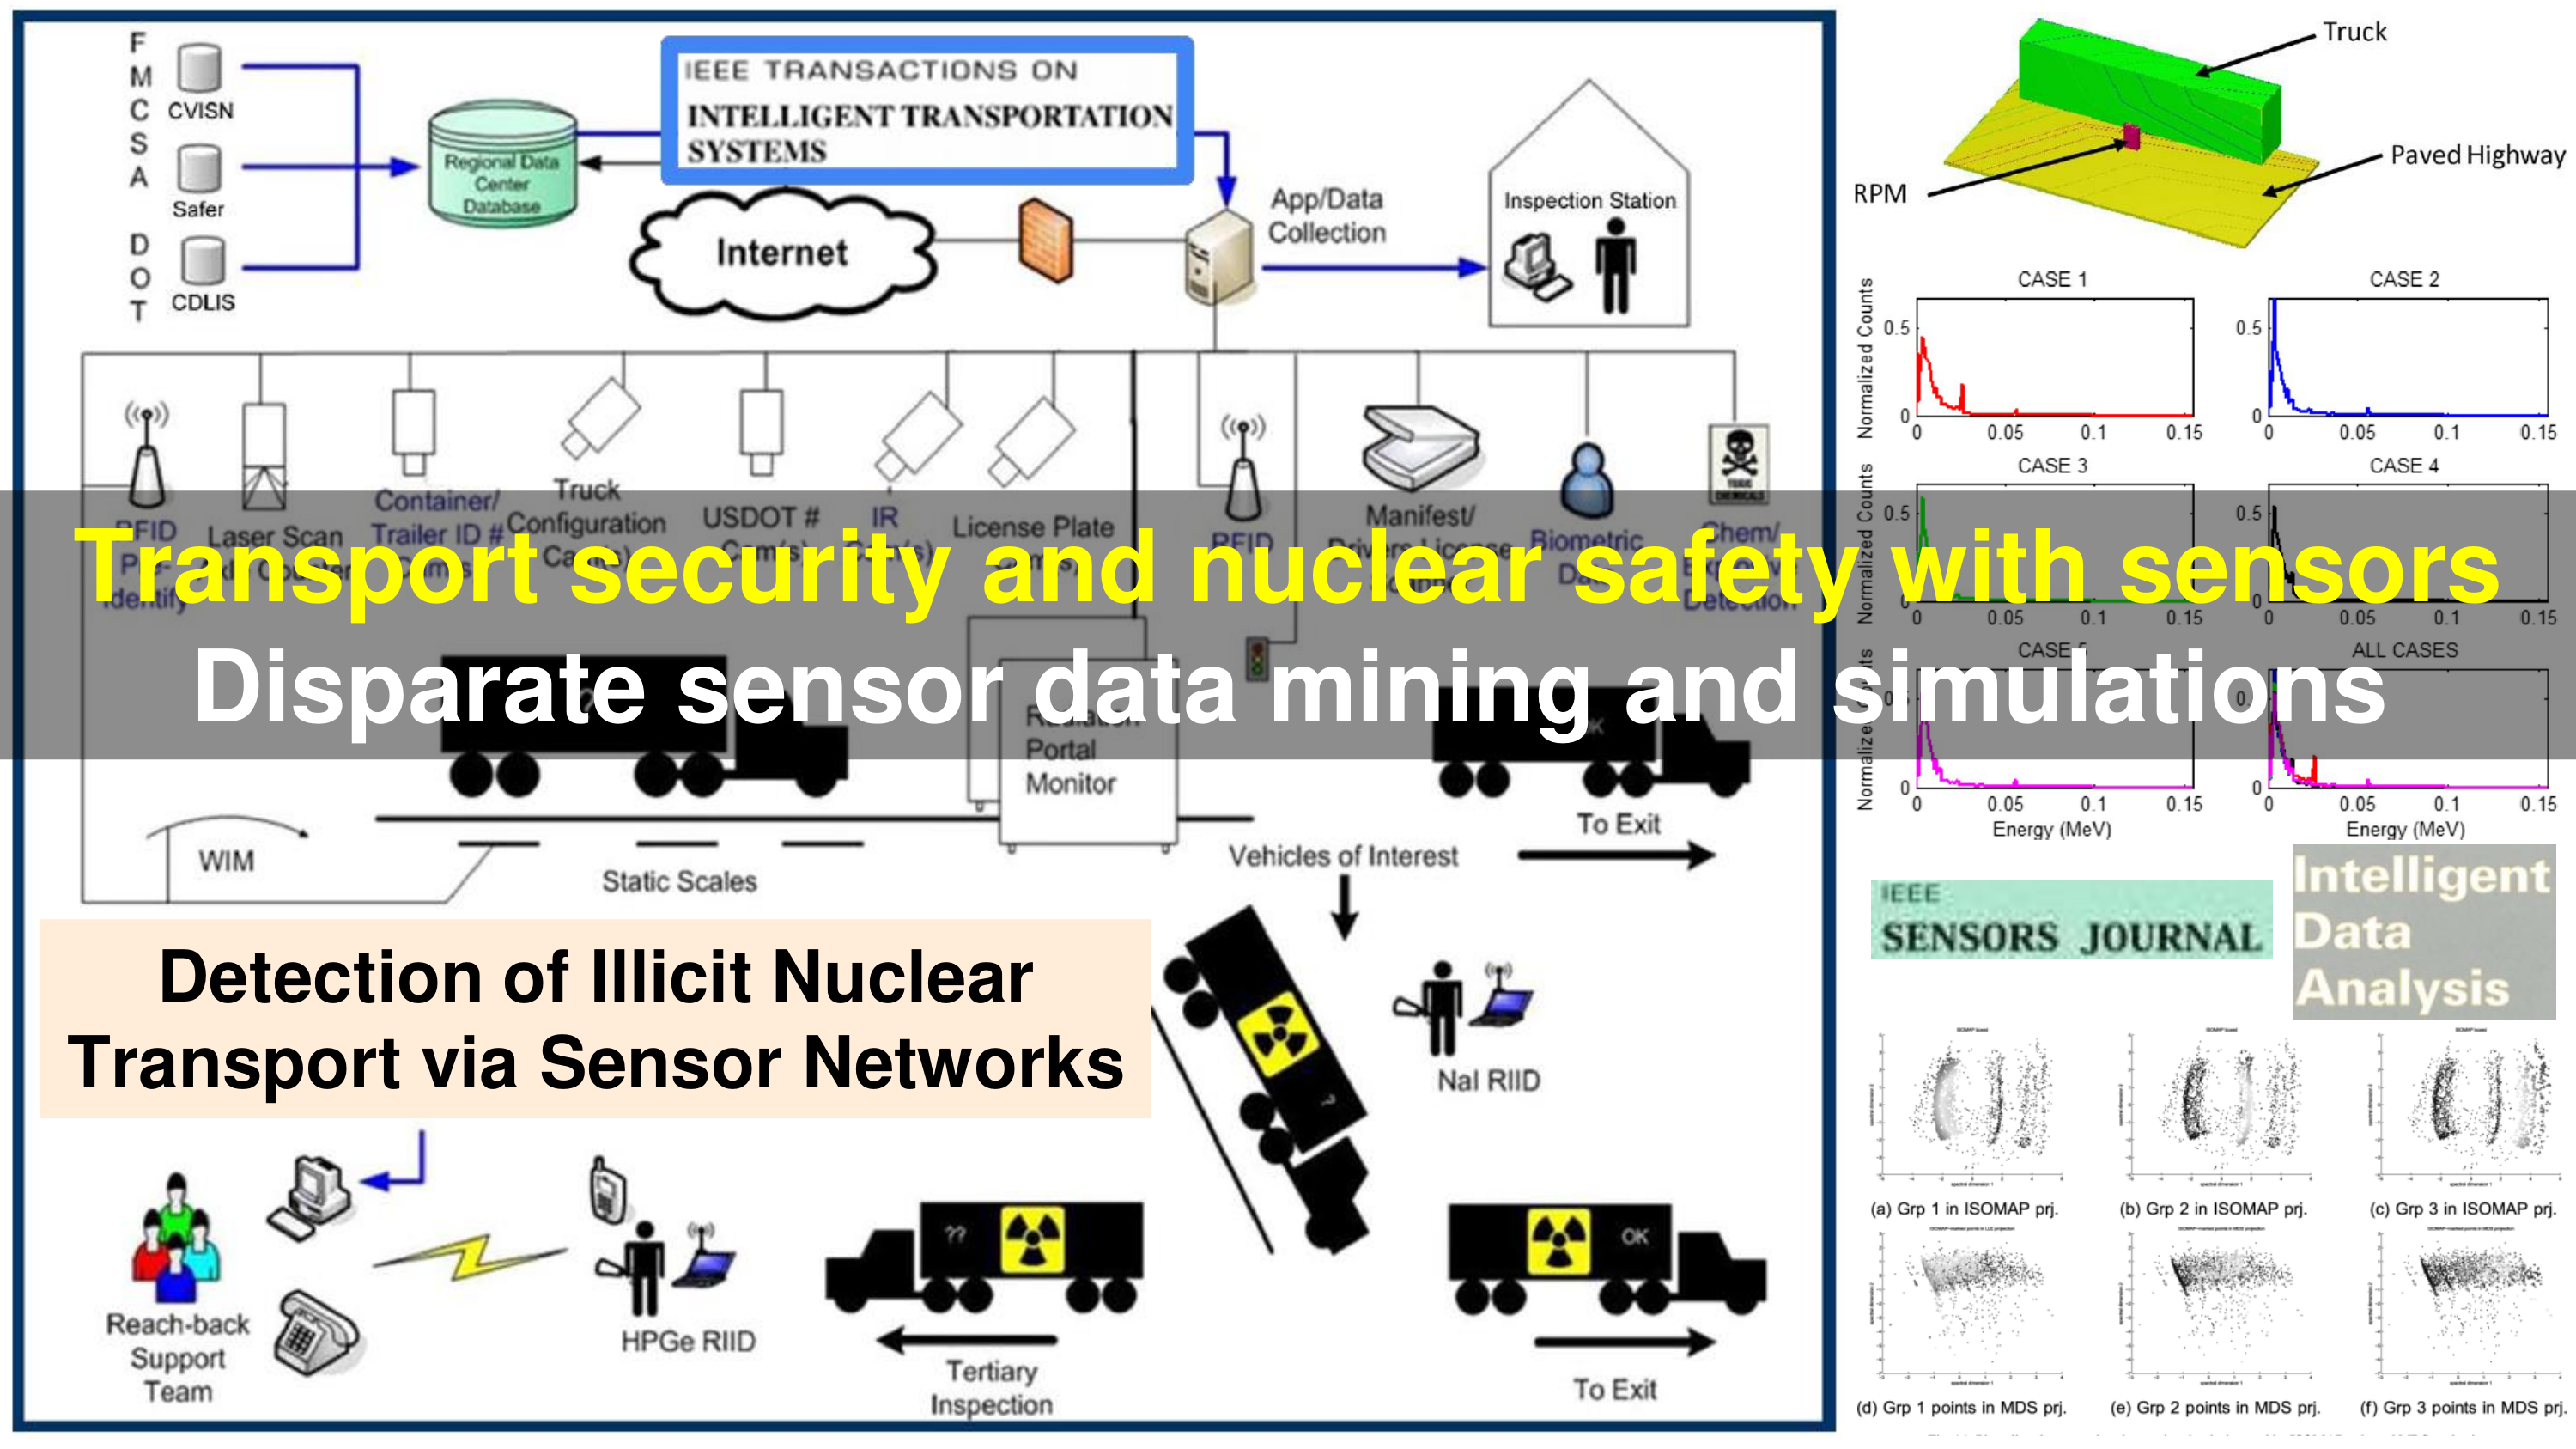
- Slide 13: Transportation Security with Sensor Data Mining
- IEEE Transactions ITS paper: Omitaomu, O.A.*, Ganguly, A.R., Patton, B.W. and Protopopescu, V.A., 2009. Anomaly detection in radiation sensor data with application to transportation security . IEEE Transactions on Intelligent Transportation Systems, 10(2), pp.324-334.
- IDA paper: Agovic, A., Banerjee, A., Ganguly, A. and Protopopescu, V., 2009. Anomaly detection using manifold embedding and its applications in transportation corridors . Intelligent Data Analysis, 13(3), pp.435-455.
- IEEE Sensors paper: Omitaomu, O.A.*, Protopopescu, V.A. and Ganguly, A.R., 2011. Empirical mode decomposition technique with conditional mutual information for denoising operational sensor data . IEEE Sensors Journal, 11(10), pp.2565-2575.
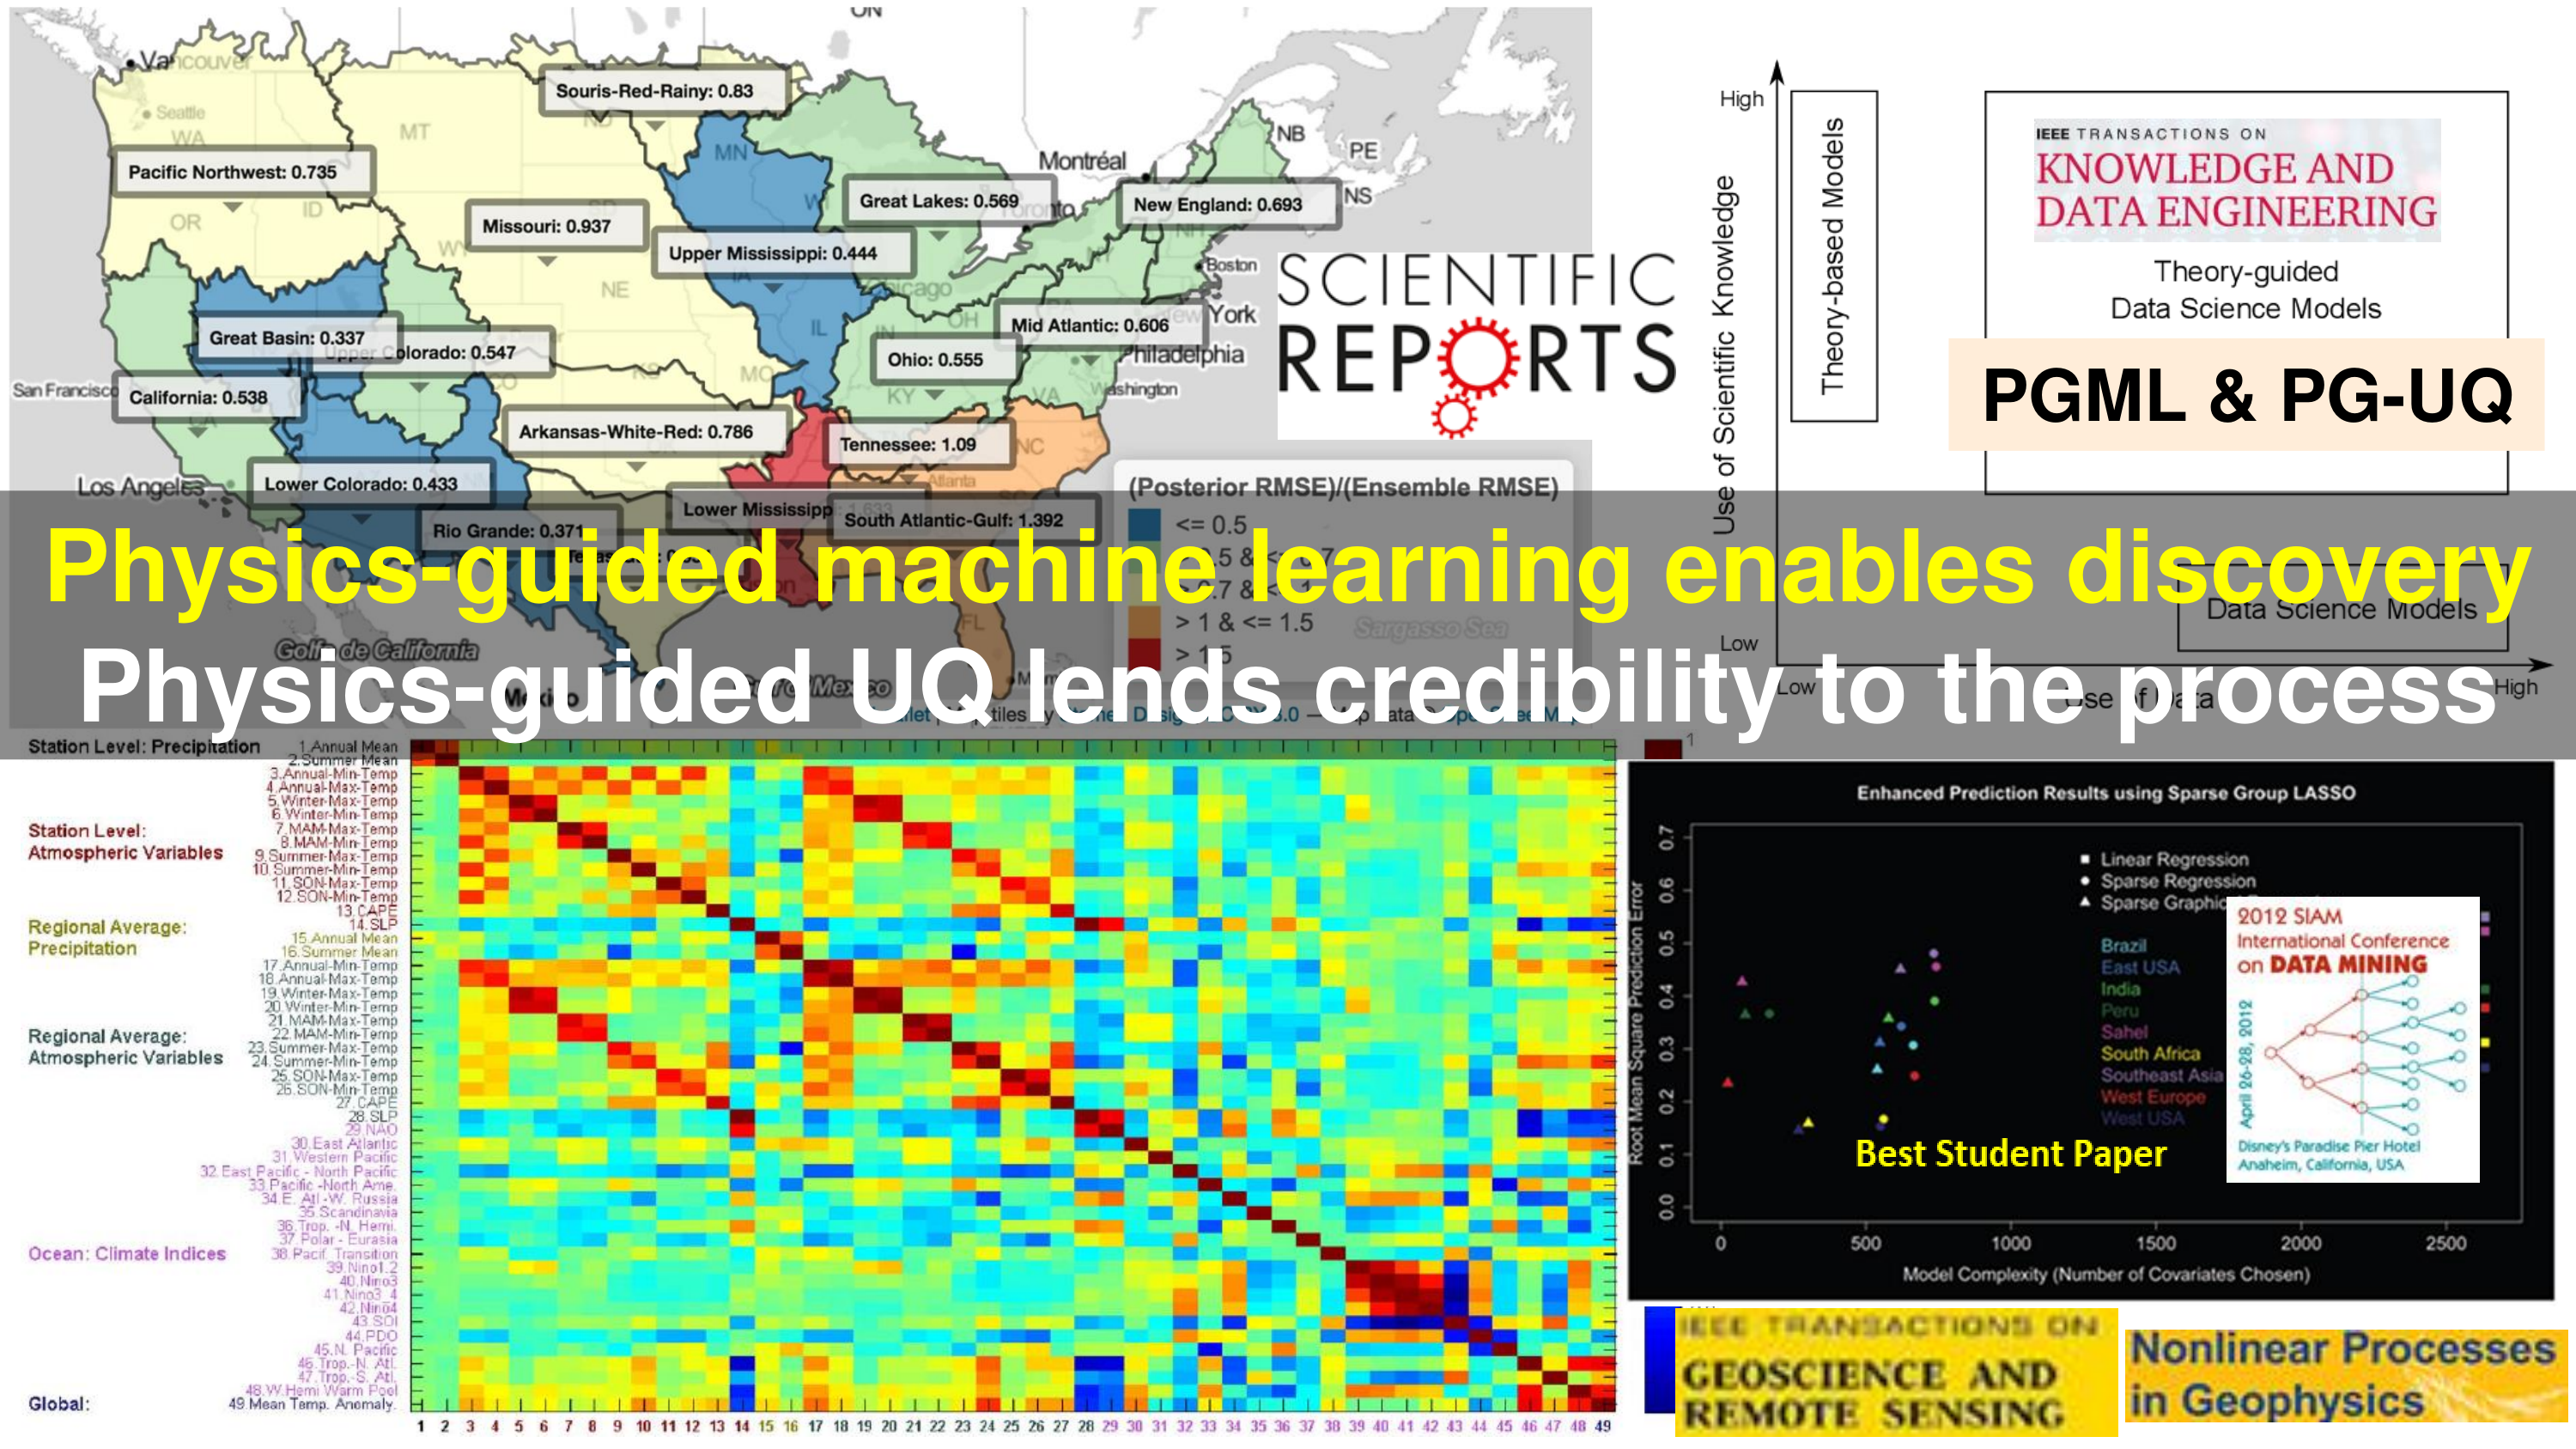
- Slide 14: Physics-Informed Machine Learning and Uncertainty Quantification
- SREP paper: Kodra, E.*, Bhatia, U.*, Chatterjee, S., Chen, S.* and Ganguly, A.R., 2020. Physics-guided probabilistic modeling of extreme precipitation under climate change . Scientific Reports, 10(1), 10299.
- IEEE Transactions KDE paper: Karpatne, A., Atluri, G., Faghmous, J.H., Steinbach, M., Banerjee, A., Ganguly, A., Shekhar, S., Samatova, N. and Kumar, V., 2017. Theory-guided data science: A new paradigm for scientific discovery from data . IEEE Transactions on Knowledge and Data Engineering, 29(10), pp.2318-2331.
- NPG perspective: Ganguly, A.R., Kodra, E.*, Agrawal, A., Banerjee, A., Boriah, S., Chatterjee, Sn., Chatterjee, So., Choudhary, A., Das, D.*, Faghmous, J., Ganguli, P.*, Ghosh, S., Hayhoe, K., Hays, C., Hendrix, W., Fu, Q., Kawale, J., Kumar, D.*, Kumar, V., Liao, W., Liess, S., Mawalagedara, R.*, Mithal, V., Oglesby, R., Salvi, K., Snyder, P.K., Steinhaeuser, K.*, Wang, D.*, D. Wuebbles (2014): Toward enhanced understanding and projections of climate extremes using physics-guided data mining . Nonlinear Processes in Geophysics, 21, 777-795.
- NPG paper: Das, D.*, Dy, J., Ross, J., Obradovic, Z. and Ganguly, A.R., 2014. Non-parametric Bayesian mixture of sparse regressions with application towards feature selection for statistical downscaling . Nonlinear Processes in Geophysics, 21(6), pp.1145-1157.
- IEEE Transactions GRS paper: Das, D.*, Ganguly, A.R. and Obradovic, Z., 2015. A Bayesian sparse generalized linear model with an application to multiscale covariate discovery for observed rainfall extremes over the United States . IEEE Transactions on Geoscience and Remote Sensing, 53(12), pp.6689-6702.
- SIAM Data Mining paper: Chatterjee, S., Steinhaeuser, K., Banerjee, A., Chatterjee, S. and Ganguly, A., 2012, April. Sparse group lasso: Consistency and climate applications . In Proceedings of the 2012 SIAM International Conference on Data Mining (pp. 47-58). Society for Industrial and Applied Mathematics. Best Student Paper Award.
- Slide 15: Bayesian Deep Learning for Climate Prediction and Uncertainty Quantification
- KDD 2017 paper: Vandal, T.*, Kodra, E.*, Ganguly, S., Michaelis, A., Nemani, R. and Ganguly, A.R., 2017, August. DeepSD: Generating high resolution climate change projections through single image super-resolution . In Proceedings of the 23rd ACM SIGKDD International Conference on Knowledge Discovery and Data Mining (pp. 1663-1672). Runner-up Best Paper Award.
- Nature Comment (citation 2): Joppa, L.N., 2017. The case for technology investments in the environment . Nature 552, 325-328.
- KDD 2018 paper: Vandal, T.*, Kodra, E.*, Dy, J., Ganguly, S., Nemani, R. and Ganguly, A.R., 2018, July. Quantifying uncertainty in discrete-continuous and skewed data with Bayesian Deep Learning . In Proceedings of the 24th ACM SIGKDD International Conference on Knowledge Discovery & Data Mining (pp. 2377-2386).
- IJCAI 2018 paper: Vandal, T.*, Kodra, E.*, Ganguly, S., Michaelis, A., Nemani, R. and Ganguly, A.R., 2018, July. Generating high resolution climate change projections through single image super-resolution: an abridged version . In Proceedings of the 27th International Joint Conference on Artificial Intelligence (pp. 5389-5393).
- Nature Perspective (see Figure 2b and Citation 72): Reichstein, M., Camps-Valls, G., Stevens, B., Jung, M., Denzler, J. and Carvalhais, N., 2019. Deep learning and process understanding for data-driven Earth system science . Nature, 566(7743), pp.195-204.
- KDD 2019 paper: Liu, Y., Chen, J., Ganguly, A. and Dy, J., 2019, July. Nonparametric Mixture of Sparse Regressions on Spatio-Temporal Data--An Application to Climate Prediction . In Proceedings of the 25th ACM SIGKDD International Conference on Knowledge Discovery & Data Mining (pp. 2556-2564).
- KDD 2020 paper: Liu, Y., Ganguly, A.R. and Dy, J., 2020, August. Climate Downscaling Using YNet: A Deep Convolutional Network with Skip Connections and Fusion . In Proceedings of the 26th ACM SIGKDD International Conference on Knowledge Discovery & Data Mining (pp. 3145-3153).
- 2014 KDD-Workshop paper: An, X.*, Ganguly, A.R., Fang, Y., Scyphers, S.B., Hunter, A.M. and Dy, J.G., 2014, August. Tracking climate change opinions from twitter data . In ACM KDD Workshop on Data Science for Social Good (pp. 1-6).
- 2020 KDD-Workshop paper: Yadav, N.*, Ravela, S. and Ganguly, A.R., 2020. Machine Learning for Robust Identification of Complex Nonlinear Dynamical Systems: Applications to Earth Systems Modeling . In ACM KDD Workshop on Fragile Earth.
- Slide 16: Broader Implications for Societal Grand Challenges
- Climate Ready Boston (City of Boston): 2016 BRAG Report (Temperature Extremes section)
- Thriving Earth Exchange (Town of Brookline, MA, and AGU): TEX Project; NU News on Award-Winning Poster
- Primary Experiential Partners: NASA; US DOE's ORNL and PNNL; startup risQ
- Regulatory Principles under Climate Uncertainty: Buffalo Law Review
- Climate 2020 (United Nations Association of the United Kingdom): Data-Driven Solutions
- US Sustained National Climate Assessment (Lead of AI section): SCAN website; Full Report; Summary; Nature News
- United Nations (UN) Assessments: Cited in IPCC AR5; IPCC SR15; see also SREX quotes (Boston Globe; CBC; CBS)
- US National Assessments: Cited in US NCA4 (Vol. I and Vol. II)
- Climate Extremes and Impacts in India: Heat Waves; Heavy Precipitation; Kolkata US Consulate; VAIBHAV Summit (multiple panels in climate, hydrology, AI)
- Artificial Intelligence Program Committees: AAAI-21; KDD 2020; KDD 2021; Fragile Earth (workshop with KDD)
- Editorial Boards and Societal Committees: PLOS ONE; Scientific Reports (Nature Research); Specialty Chief Editor (Frontiers); ASCE Climate Adaptation (Committee); ASCE Convention (Keynote) ASCE JCCE (past); AMS AI Committee (past); AGU Water Resources Research (past)
- UN Review Panel (Ozone Depletion and Climate Change): 2010 Assessment; 2018 Assessment; NU News
For a full list of publications, visit the PI’s Google Scholar page here.
US Patents
- US Patent on Climate Risk Analytics
- Title: System for multivariable climate change forecasting with uncertainty quantification
- US Patent Number: US Patent Number: 10488556
- Inventors: Evan Kodra*, Auroop R. Ganguly
- Assignee: Northeastern University, Boston, MA (NU News)
- Date granted: November 26, 2019
- US Patent on Infrastructure Network Resilience
- Title: System for networking and analyzing geospatial data, human infrastructure, and natural elements
- US Patent Number: US Patent Number: 10361907
- Inventors: Udit Bhatia*, Devashish Kumar*, Evan Kodra*, Auroop R. Ganguly
- Assignee: Northeastern University, Boston, MA (NU News)
- Date granted: July 23, 2019